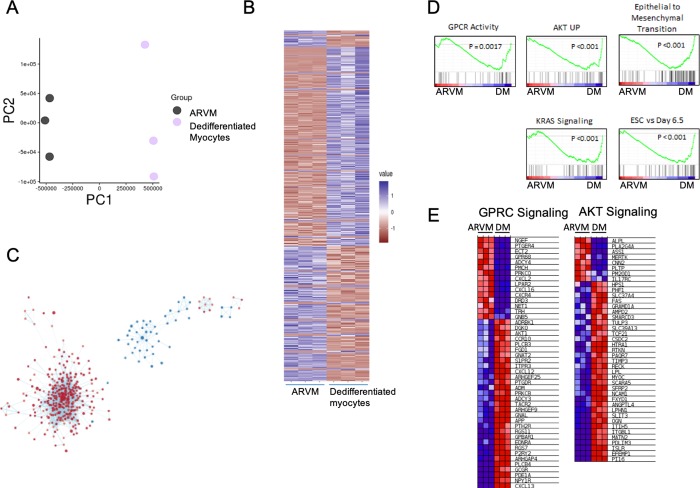
Fig 6. Dedifferentiated adult ventricular myocyte (ARVM) RNAseq.
A) PCA plot of ARVMs treated with and without conditioned media from PH fibroblasts. B) Heatmap of gene expression comparing control, freshly isolated ARVMs to ARVMs treated with PH Fibroblast conditioned media. Genes with a significant difference of <0.05 were selected. Expression values were scaled from -1 to 1, similarity was calculated using an euclidean distance and clustered using a centroid linkage k-means method. C) Network of transcriptional changes. We displayed differentially enriched pathways from GSEA as enrichment networks in which each node is a pathway, and each link between nodes is a common gene. The size of the nodes indicates the number of genes found in our data that are in the pathway. Red coloring indicates pathways enriched in the ARVM PH group, whereas blue indicates pathways enriched in the control ARVM group. D) Select enrichment plots highlighting the enriched pathways identified by GSEA. E) Representative heat maps for G-protein coupled receptor, downstream signaling pathways (GPCR signaling) and AKT signaling pathways showing the genes responsible for enrichment.

