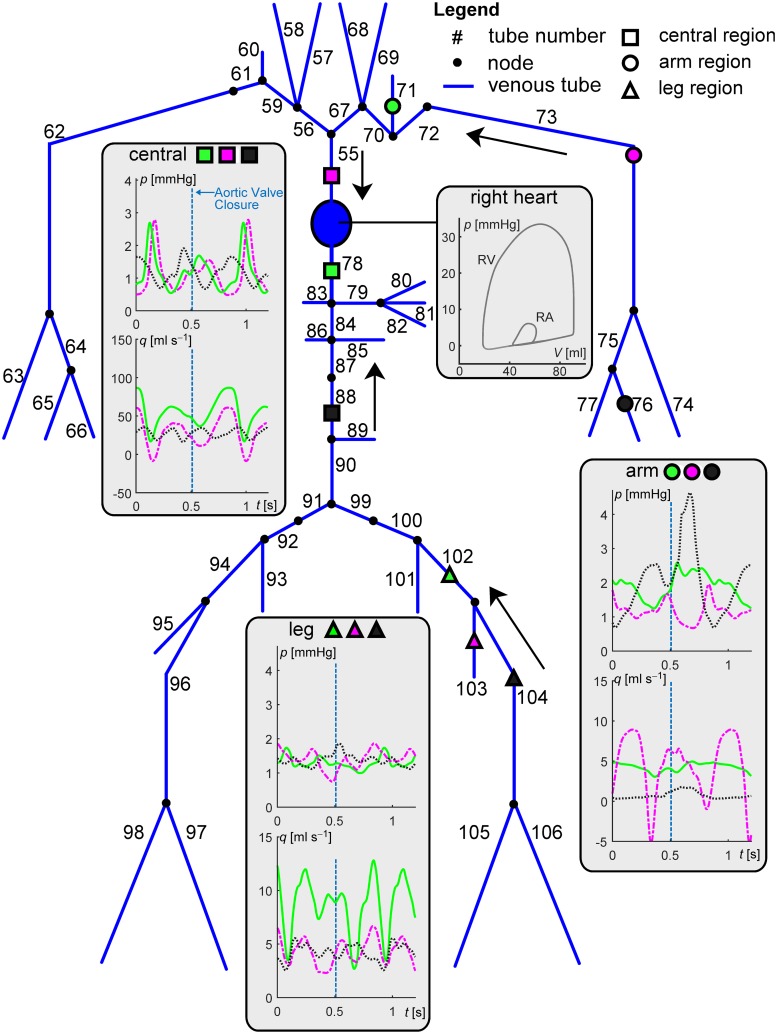
Fig 3. Overview of the complete venous model domain.
Geometrical and mechanical properties of modelled veins are given in Table C in S1 Text. Panels display pressure and flow waveforms for three regions; central, arm and leg, indicated using symbol and colour coding. Line type indicates the distance from the heart within a region; proximal: solid line, intermediate: dash-dotted line, distal: dotted line, respectively. Grey curves display right ventricular (RV) pressures and volumes, right atrial (RA) pressures and volumes. Arrows indicate the direction of mean blood flow. Aortic valve closure is indicated by the vertical blue dashed lines.

