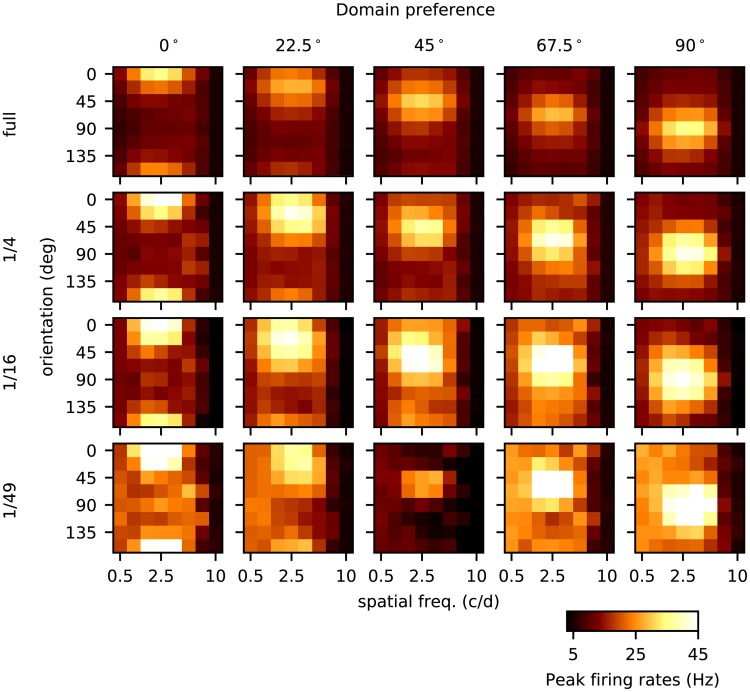
Fig 2. Orientation and spatial frequency tuning for four model cortices.
This figure shows 20 panels each one of which gives the responses of a group of neurons to 64 different gratings. Each row represents responses of a different size cortex: full-size, 1/4-, 1/16-, and 1/49-cortices from top to bottom. In each model cortex, we divided the region around the pinwheel center into 8 wedges evenly spaced, and the 5 columns show responses from E-neurons in wedges that, if all went according to plan, would have orientation preferences 0°, 22.5°, 45°, 67.5° and 90° respectively. Within each panel are responses to 64 gratings drifting across the visual fields of the model cortices at 4 Hz. In the x-axis are the spatial frequencies of the grating ranging from 0.5 to 10 c/d, and in the y-axis are orientations of the gratings from 0° to 157.5° evenly spaced. The color of each little square represents the peak firing rate averaged over the E-neurons in that wedge; see color bar at the bottom. For the full cortex, one sees that the strongest responses, from left to right for rows 1–5 of each panel, coincide with the intended preference of the wedge. The same is true for the other three cortices. The preferred SF for this layer of V1 is between 2-3 c/d [20], which corresponds to the third to fifth columns from the left within each panel. Both orientation and SF preferences are correctly reflected in all 20 panels, indicating that all four cortices have at least moderate to strong orientation and SF selectivity. But there are also differences among the cortices of different sizes: One is that peak firing rates are, on average, significantly higher in the smaller cortices (even though by design all have similar mean firing rates). The second is that the 1/49-cortex shows greater inconsistency in its response across the 5 wedges.

