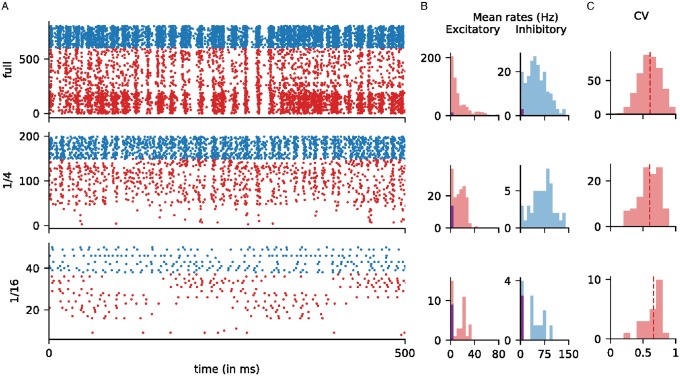
Fig 5. Population dynamics in model cortices of various sizes.
Statistics for three model cortices are shown: the full-size cortex (top row), 1/4-cortex (middle) and 1/16-cortex (bottom). A. Rasters of neurons in an optimally driven patch when driven by a high-contrast grating. The x-axis is time, and the y-axis is neuron number, and dots indicate when spikes occurred. Excitatory neurons are in red; Inhibitory ones are in blue. The E-neurons are ordered by the number of LGN inputs, from 1 LGN (bottom) to 6 LGN (top). B. Distributions of mean firing rates of the E and I neurons in the same patch. The purple bars on the left of each histogram indicate silent neurons, i.e., neurons that did not fire. For the smaller cortices, the E-neuron distributions show bimodality, as neurons with fewer LGN inputs became increasingly silent. C. Distributions of CV of the E neurons in the same optimally driven patch. Only those neurons with firing rates above 5 Hz are shown.

