
Figure 1. Success of differentiation and transcriptional reliability of human cortical spheroids.
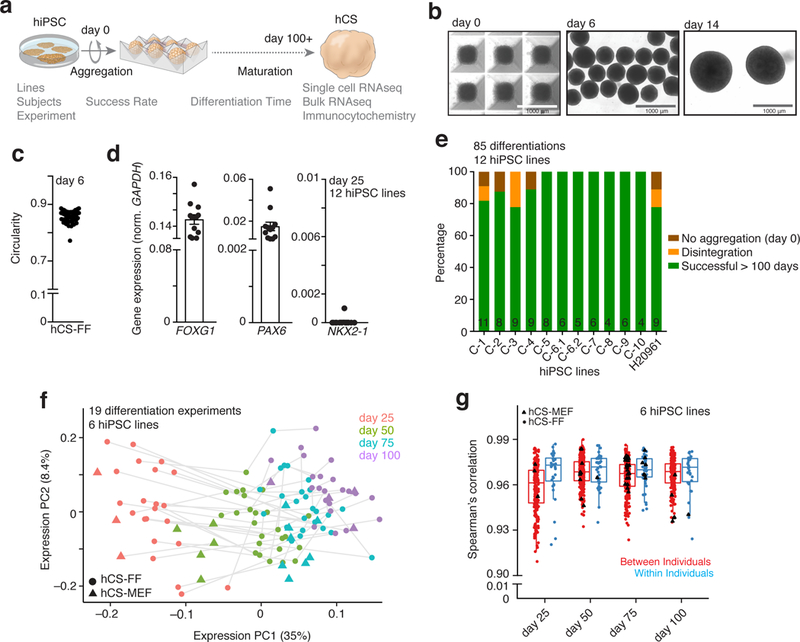
a, Scheme illustrating the derivation of hCS-FF from hPSCs and the assays used. b, Representative images of neural spheroids at day 0, 6 and 14 of differentiation. c, Circularity (4p × area/perimeter2) of day 6 neural spheroids derived from 4 hiPSC lines. A value of 1.0 indicates a perfect circle. d, Gene expression of FOXG1, PAX6, NKX2.1 relative to GAPDH in hCS-FF at day 25 of Differentiation (n = 12 hiPSC lines from 11 subjects). Mean ± s.e.m. are shown. e, Percentage of successful differentiations up to 100 days for 12 hiPSC lines (n= 85 experiments; number per line indicated inside bars). f, Principal component analysis of hCS-FF and hCS-MEF at 4 stages of in vitro differentiation. Differentiation of the same line are indicated by a gray line (days 25, 50, 75, 100: n = 22, 25, 25, 22 hCS-FF and 3, 5, 8, 4 hCS-MEF samples, respectively). g, Spearman’s correlation of samples obtained from different individuals (between individuals) or from multiple differentiations of the same hiPSC lines (within individual); two-sided Wilcoxon–Mann–Whitney test, P< 0.03. Day 25, 50, 75, 100: n = 202, 269, 281, 206 samples (between individual) and 33, 41, 47, 31 samples (within individuals), respectively. Middle hinge corresponds to median, and lower and upper hinges correspond to first and third quartiles. RNA-seq data in f and g were obtained from n = 6 hiPSC lines derived from 6 individuals and differentiated in multiple independent differentiation experiments each.