
Figure 2. Single-cell characterization of human cortical spheroids.
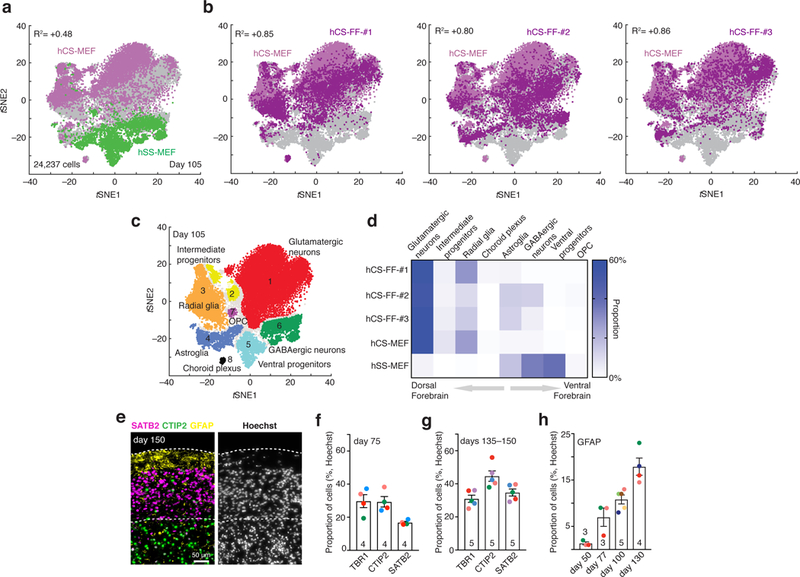
a,b, Single-cell profiling of hCS-MEF (n = 7,340 cells) and hSS-MEF n = 4,771 cells) (a) versus hCS-FF derived from 3 different individuals (hCS-FF-1, n = 4,649 cells; hCS-FF-2, n = 4,389 cells; hCS-FF-3, n = 3,088 cells) (b) at day 105 of differentiation. The correlation (log10 transformed mean of molecules per cell per gene) between total hCS-MEF and each of the hCS-MEF cultures or hSS-MEF is indicated. c,d, Clustering (c) and proportions (d) of all single cells across conditions (glutamatergic neuron cluster 1, n = 11,367 cells; intermediate progenitor cluster 2, n = 1,018 cells; radial glia cluster 3, n = 4,217 cells; astroglia cluster 4, n = 2,036 cells; ventral progenitor cluster 5, n = 1,915 cells; GABAergic neuron cluster 6, n = 2,520 cells; OPC cluster 7, n = 194 cells; choroid plexus cluster 8, n = 170 cells; 800 cells not assigned to a cluster). e, Representative cryosection at day 150 of differentiation stained for deep (CTIP2) and superficial (SATB2) neuronal markers and the glial marker GFAP. f,g, Proportion of cells expressing layer-specific cortical markers (TBR1, CTIP2, SATB2) at day 75 (f) and days 135ȓ150 (g) of differentiation from 4–5 hiPSC lines derived from 4–5 individuals (two-way ANOVA, F2,21 = 5.44, P = 0.01 for interaction; mean ± s.e.m. are shown; sample size indicated on each column). h, Developmental time course for GFAP+ cell generation, quantified in dissociated hCSs (n = 3–5 hiPSC lines per time point from 7 hiPSC lines derived from 6 individuals); ANOVA F3,11 = 21.89, P < 0.0001; mean ± s.e.m.).