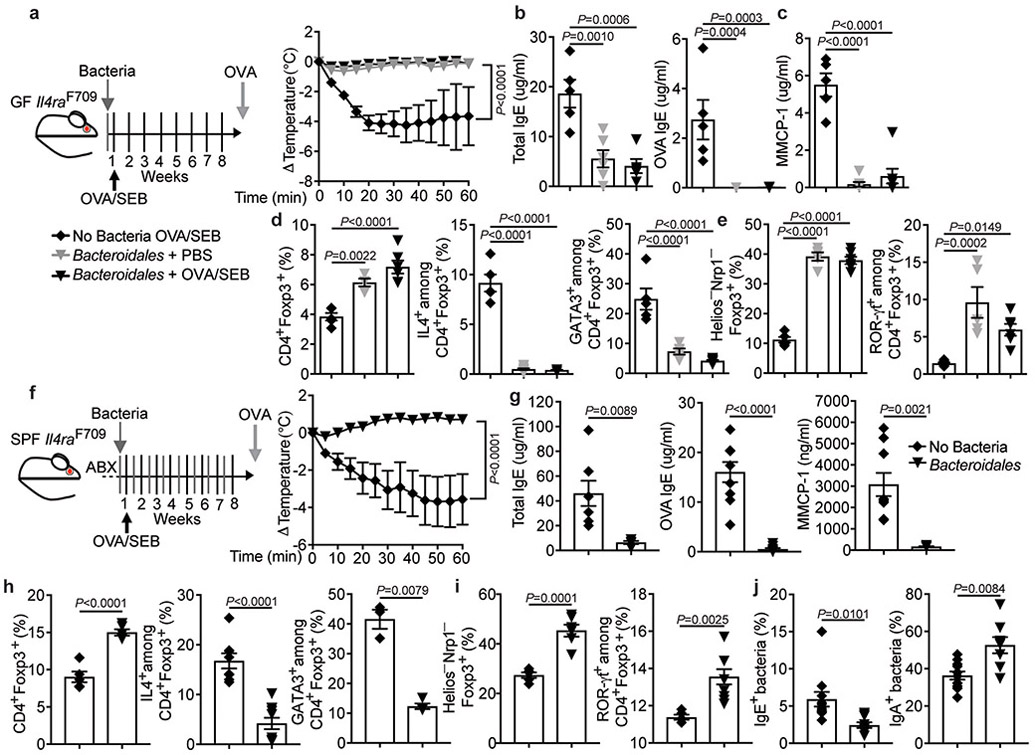
Extended Data Fig. 6. A Bacteroidales consortium prevents FA. A Bacteroidales consortium prevents FA.
(a) Left: Experimental schema. Right: temperature changes in GF Il4raF709 mice that were colonized and sensitized as indicated then challenged with OVA (n=5 per group). (b,c) Total and OVA-specific IgE (b) and MMCP-1 concentrations (c). GF, OVA/SEB (n=5 per group), Bacteroidales, PBS (n=6, 7 and 7), Bacteroidales, OVA/SEB (n=6, 6 and 7). (d) Frequencies of MLN CD4+Foxp3+, IL-4+Foxp3+ and GATA3+Foxp3+ T cells. GF, OVA/SEB (n=5 per group), Bacteroidales, PBS (n=4, 8 and 5), Bacteroidales, OVA/SEB (n=6, 5 and 6). (e) Frequencies of Helios−Nrp1−Foxp3+ and ROR-γt+Foxp3+ T cells. GF, OVA/SEB (n=5 and 7), Bacteroidales, PBS (n=5 per group), Bacteroidales, OVA/SEB (n=6 per group). (f) Left: Experimental Schema. Right: temperature changes in Il4raF709 mice sensitized and treated as indicated. OVA/SEB (n=6), OVA/SEB, Bacteroidales, (n=5). (g) Total and OVA-specific IgE and MMCP-1 concentrations. OVA/SEB (n=7, 9 and 9), OVA/SEB, Bacteroidales, (n=5, 10 and 5). (h,i) Frequencies of MLN CD4+Foxp3+, IL-4+Foxp3+ and GATA3+Foxp3+ (h) and Helios−Nrp1−Foxp3+ and ROR-γt+Foxp3+ T cells (i). OVA/SEB (n=5, 8 and 3, 5 and 5), OVA/SEB, Bacteroidales (n=5, 10, 4, 6 and 9). (j) IgE and IgA staining of fecal bacteria. OVA/SEB (n=11 per group), OVA/SEB, Bacteroidales (n=8 per group). Each dot represents one mouse. Data represent mean ± s.e.m. from two independent experiments. P values were derived by repeat measures two-way ANOVA (a,f), by one-way ANOVA with Dunnett post hoc analysis (b-e) or by Student’s unpaired two tailed t test (h-j).

