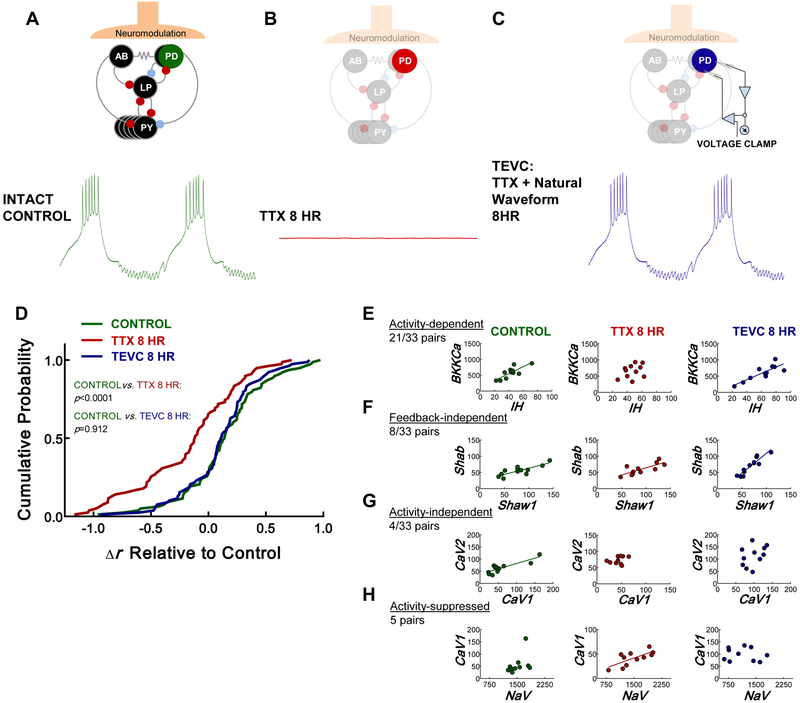
Figure 2. Physiological voltage activity, independent of chemical input, influences coordinated ion channel expression in PD neurons.
(A-C) Diagram illustrating the experimental groups used to determine the role of voltage activity in correlating ion channel mRNA expression. (A) Activity of the PD neuron caused by normal intact synaptic inhibition, neuromodulation, and electrical coupling in the pyloric network. (B) Voltage trace from the same neuron after it has been silenced by exposing the STG to 10−7 M TTX and transecting the stn that contains the neuromodulatory fibers innervating the STG (8 hr). These preparations are devoid of activity, synaptic input, and neuromodulation. (C) The same neuron lacking endogenous input, but with its membrane potential artificially driven to its original activity pattern by a voltage clamp protocol “played back” to the cell using two-electrode voltage clamp (TEVC) for 8 hr. These preparations are devoid of neuromodulation and synaptic input, but now maintain voltage activity through TEVC. (D) Cumulative probability distribution showing that the change in Pearson’s correlation coefficient (Δr for each pairwise correlation decreases relative to the control group (green) from series 2 in silent PD neurons (TTX 8 hr, red; Kolmogorov-Smirnov test; p<0.0001; n= 12 control and n=11 silent), but not in PD neurons with physiological voltage activity maintained for 8 hr using TEVC. (TEVC 8 hr, blue; Kolmogorov-Smirnov test; p=0.912; n=12 TEVC neurons). The control distribution for this analysis was generated by subtracting the series 2 control r values from the r values in series 1. (E-H) Examples of the different ways correlations arise in the PD neuron. Left column=control, middle column=silent, and right column= TEVC. (E) Example where voltage activity determines correlation between two channel mRNAs. (F) Example where correlation does not depend on activity or chemical feedback. (G) Example where a correlation does not depend on activity, but may rely on trophic feedback. (H) Example where a correlation only appears without activity. Each point represents a single neuron. Regression lines were drawn when p<0.05 (Pearson’s test). See also Figure S1, Tables S1-S4.

