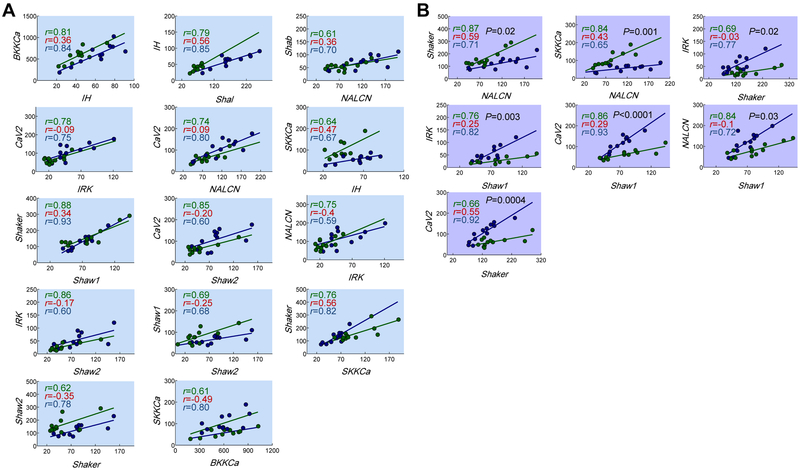
Figure 3. Physiological voltage activity maintains the quantitative relationships between most correlated ion channel pairs.
(A) 14 of the 21 bona fide voltage-dependent channel relationships have slopes that are not significantly different when activity is caused by normal network interactions (green) or TEVC (blue) [analysis of covariance (ANCOVA); p values ranged from 0.08-0.94]. Each relationship shown in (A) was significant with control (green) or the TEVC (blue), but not in isolated neurons (Pearson’s test; p<0.05). r values for silent PD neurons are presented in red text on the plots to show the loss of correlation. (B) 7/21 bona fide activity-dependent channel relationships have slopes that were significantly different when activity is caused by the voltage clamp in isolated neurons (ANCOVA; p <0.05; shown in black text on plots). Each point represents a single neuron. Regression lines were drawn when p<0.05 (Pearson’s test). See also Table S1.

