. 2019 Jun 28;8:e46808. doi: 10.7554/eLife.46808

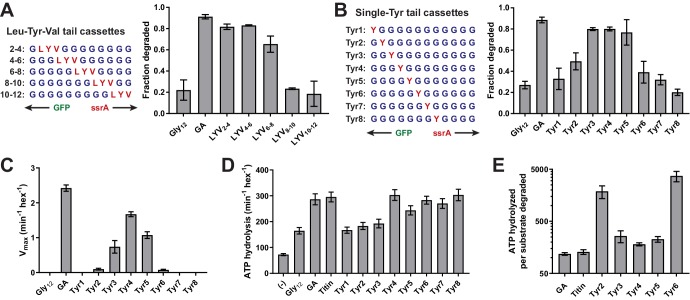
Figure 2. A small subset of tail residues mediate grip during GFP unfolding.

(A) Fraction intracellular degradation for substrates with tails containing LYV tripeptides in otherwise all-glycine cassettes. Gly12 and GA substrates were included as internal controls. (B) Fraction intracellular degradation for substrates with tails containing one tyrosine (Y) in otherwise all-glycine cassettes. Gly12 and GA substrates were included as internal controls. (C) Vmax values from Michaelis-Menten analysis of degradation of purified substrates with single-tyrosine cassettes. (D) Rates of ATP hydrolysis by ClpXΔN (0.1 μM hexamer) in the presence of ClpP (0.3 μM 14-mer) in the absence (–) or presence of different substrates (15 μM monomer). (E) ATP cost of degrading substrates with single-tyrosine cassettes. Note that the Y-axis is logarithmic. In all panels, values represent averages (± S.D.) of three biological replicates.

Figure 2—source data 1. Stimulation of ClpXP ATP hydrolysis by purified substrates.
Values are averages of three biological replicates ± S.D.
DOI: 10.7554/eLife.46808.009

Figure 2.

Figure 2—figure supplement 1. Comparison of KM values for substrates tested in vitro; comparison of fitted values for KM for substrate degradation.

Figure 2—figure supplement 1.

Values are the average of three biological replicates ± S.D. None of the substrates exhibited a substantial increase in KM, indicating that differences in degradation rates result from differences in grip rather than in initial substrate recognition.
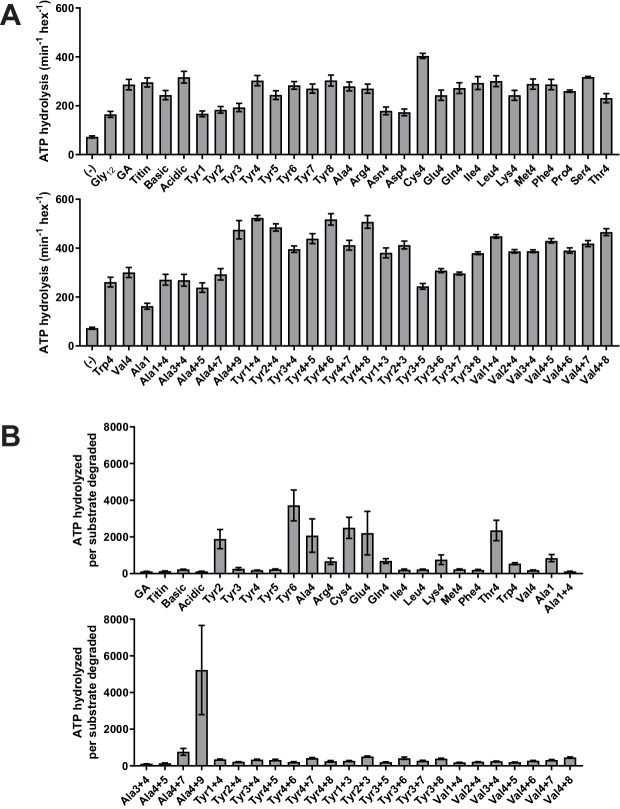
Figure 2—figure supplement 2. Stimulation of ClpXP ATP hydrolysis by purified substrates.

Figure 2—figure supplement 2.

(A) Rates of ATP hydrolysis by ClpXΔN (0.1 μM hexamer) in the presence of ClpP (0.3 μM 14-mer) in the absence (–) or presence of different substrates (15 μM monomer). (B) ATP cost of degrading substrates. In both panels, values represent averages (± S.D.) of three biological replicates.