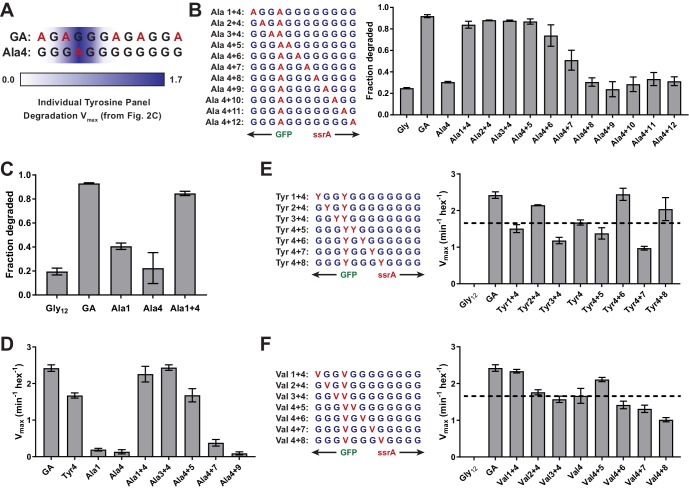
Figure 4. Multiple substrate residues contribute synergistically to grip.
(A) GA and Ala-4 cassette sequences. A heatmap of Vmax values from Figure 2C is overlaid to show contribution of single tyrosine residues as each tail position. (B) Fraction intracellular degradation of substrates with one alanine at tail-position 4 and a second alanine at a variable position in otherwise all-glycine cassettes. (C) Comparison of intracellular degradation for a subset of substrates, including Ala-1. (D) Vmax values from Michaelis-Menten analysis of degradation of purified substrates. (E and F) Michaelis-Menten Vmax values for purified substrates with one tyrosine (E) or valine (F) at tail-position four and a second tyrosine (E) or valine (F) at each tail position in otherwise all-glycine cassettes. Overlaid dashed lines indicate degradation rate for the parental Tyr-4 (E) or Val-4 (F) substrates. In all panels, values represent averages (± S.D.) of three biological replicates.


