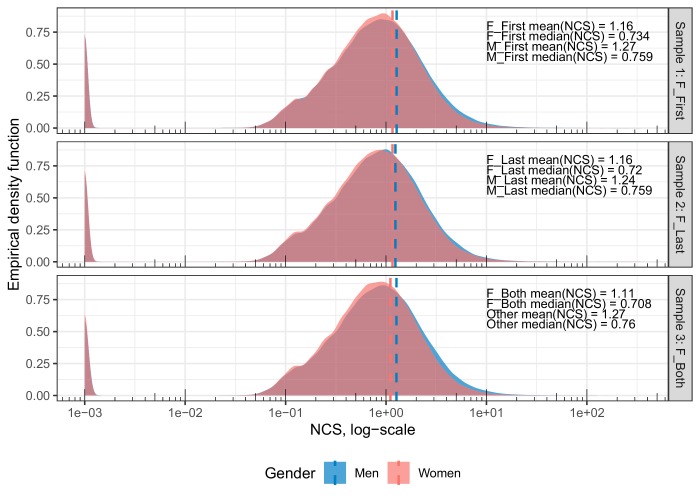
Figure 1. Density distributions of the log-transformed, per-paper NCS for the matched set of male and female first authors (Sample 1), female and male last authors (Sample 2), and female first and last authors vs. other author combinations (Sample 3).
Dashed lines indicate the mean NCS for each sample. The y-axis indicates the proportion of papers found in that area of the NCS, equivalent to a smoothed histogram. The x-axis gives the per-paper NCS on a log-transformed scale. For all distributions, between-group overlap is extensive (93.1% to 95.6%). The difference between men and women is most clearly seen in the exceptionally highly cited studies, of which there are relatively few. Please note that. 001 (=1e-03) has been added to NCS in order to include uncited papers. The left-most peak in each sample represents uncited papers. The proportion of uncited papers per sample is 5.7%, 6.1%, and 5.9% for the case papers and 5.9%, 5.9%, and 5.8% for the control papers.

