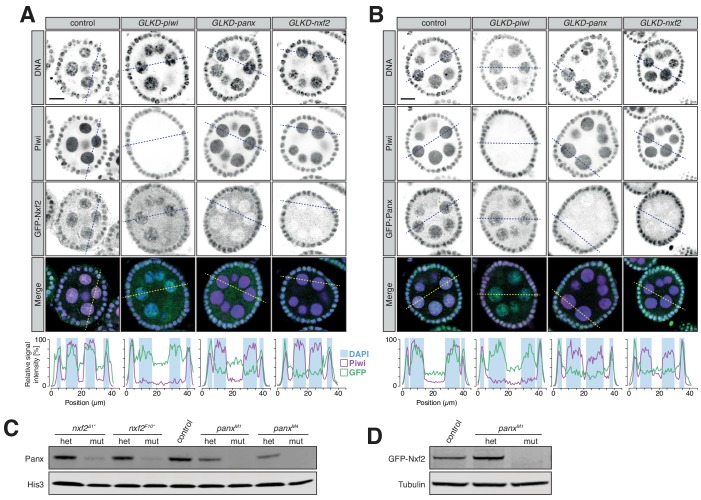
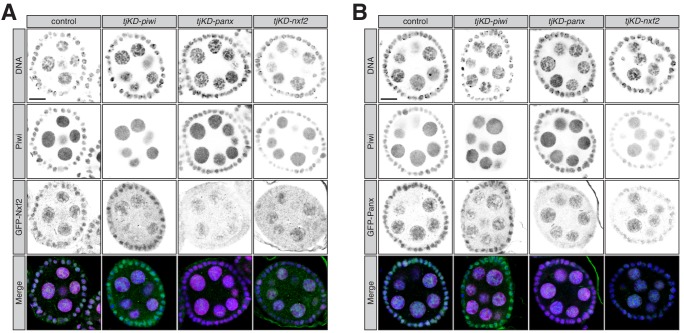
Figure 2. Protein stability and localization of Nxf2 and Panx is reciprocally co-dependent.
(A) Expression and localization of Piwi and GFP-Nxf2 in egg chambers upon germline-specific knockdown (GLKD) of the indicated factors are shown by immunofluorescence (GFP, green; Piwi, magenta; DNA, blue). Scale bar, 10 µm. Plot profiles showing the relative signal intensity of Piwi (magenta), GFP-Nxf2 fusion protein (green) and DAPI (blue background box) were computed from the indicated sections. (B) as (A) but showing GFP-Panx. (C) Western blot showing Panx protein levels in ovaries from panx and nxf2 heterozygotes and mutants compared to w1118 control flies. His3 served as loading control. (D) as (C) but showing levels of GFP-Nxf2 protein.


