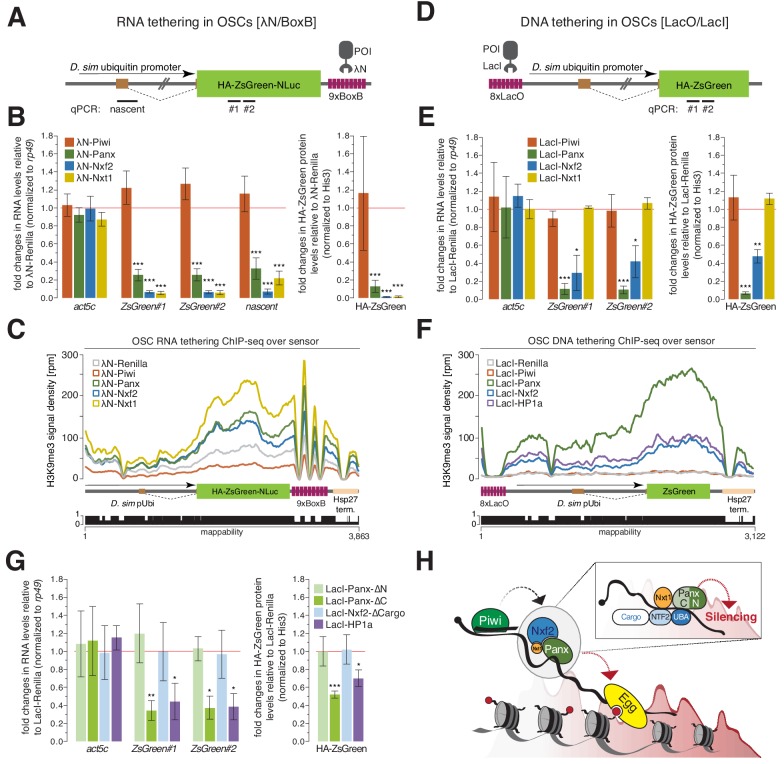
Figure 4. Recruitment of PICTS components to nascent RNA results in chromatin silencing.
(A) Cartoon displaying the RNA tethering sensor construct used in OSCs. The construct was stably integrated and features the Drosophila simulans ubiquitin promoter (which contains an intron), the ZsGreen coding sequence (fused to the HA-tag, a nuclear localization sequence and the NLuc luciferase), and a 3' UTR containing 9x BoxB sites. Amplicons for qPCR are indicated. (B) Left: Bar graphs showing fold changes in steady-state RNA levels of the sensor and act5c in total RNA from OSCs transfected with the indicated λN-fusion expression constructs (relative to a λN-Renilla construct and normalized to rp49). Right: Bar graphs showing fold changes in protein levels of HA-ZsGreen in lysates from OSCs transfected with the indicated λN expression constructs (relative to a λN-Renilla construct and normalized to His3). *** denotes P value < 0.0001 (unpaired t-test). Error bars indicate standard deviation (n = 4). (C) Density profiles of normalized reads from H3K9me3 ChIP-seq experiments mapping to the tethering reporter as indicated in the cartoon below. The mappability of reads is shown below. (D) as in (A) but showing the DNA tethering sensor. The construct features 8x LacO binding sites followed by the Drosophila simulans ubiquitin promoter and the HA-ZsGreen coding sequence. Amplicons for qPCR are indicated. (E) as in (B) but showing quantification of DNA tethering experiments. * denotes P value < 0.01; ** denotes p<0.001; *** denotes p<0.0001 (unpaired t-test). Error bars indicate standard deviation (n = 3). (F) as in (C) but showing density profiles of normalized reads from the DNA tethering reporter. (G) Quantification of DNA tethering experiments normalized to rp49 (qPCR) or His3 (protein) and relative to the same LacI-Renilla construct used in (E). * denotes P value < 0.01; ** denotes p<0.001; *** denotes p<0.0001 (unpaired t-test). Error bars indicate standard deviation (n = 3). (H) Model for piRNA-guided co-transcriptional silencing. Piwi scans for nascent transposon transcripts and upon target engagement recruits the PICTS complex to the RNA via an unknown signal. The association of the PICTS complex with target transcript causes co-transcriptional silencing, with the amino-terminus of Panx being required for silencing (insert). PICTS complex recruitment results in chromatin remodeling (H3K4me2 removal, H3K9me3 deposition), and depends on general silencing machinery factors such as Egg/dSetDB1.


