
Fig. 3. Structural variation under various dc voltages applied on the same one single crystal of FJU-23-H2O along the c axis.
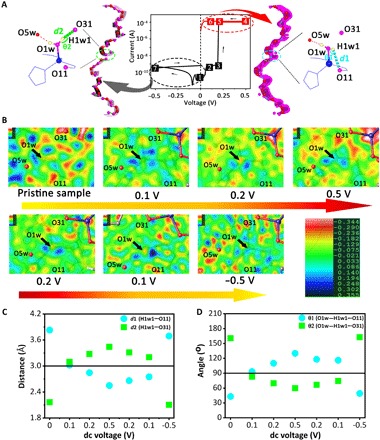
(A) The illustration of the applied dc voltages following the sequences as the points from 1 to 7. (B) The change of the electron density peaks near O1w in the original difference Fourier maps (diff) before adding H1w1 and H1w2 under the various dc voltages in the sequence above. The comparison of the distance d [H1w1(O1w)⋯O11] (d1) and d [H1w1(O1w)⋯O31] (d2) (C) and the bond angle θ (O1w─H1w1⋯O11) (θ1) and θ (O1w─H1w1⋯O31) (θ2) (D) in FJU-23-H2O under various dc voltages.