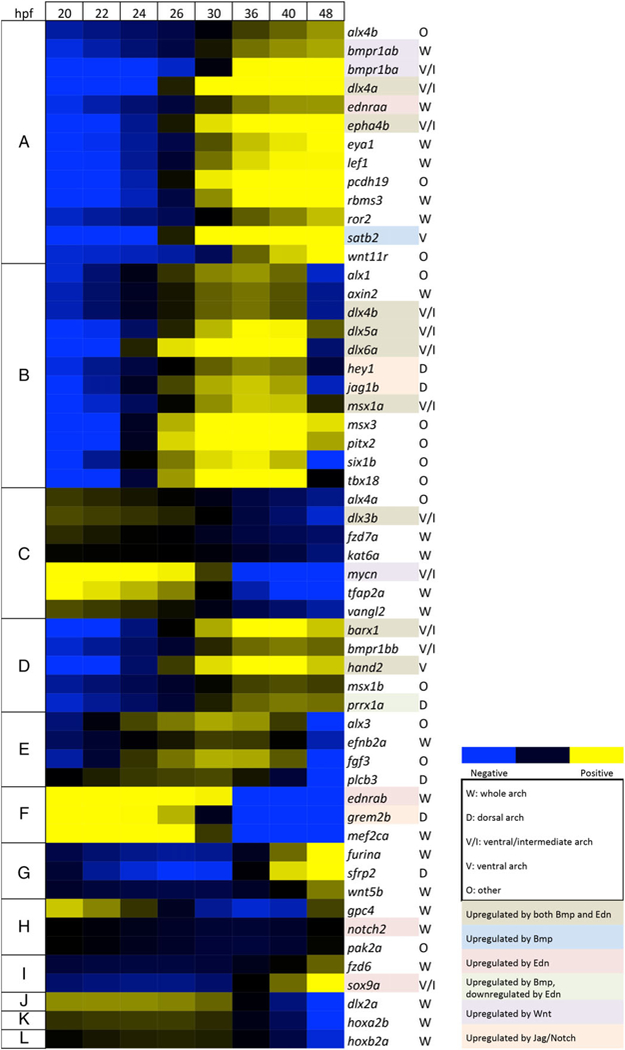
FIGURE 3.

Temporal heat map of zebrafish arch patterning genes. Heat map for 55 zebrafish genes scored based on their expression trajectories (increasing or decreasing expression) at each of seven time intervals (20–22, 22–24, 24–26, 26–30, 30–36, 36–40, and 40–48 hpf). Nine groups (A-1) had similar temporal expression trajectories, either expressed early or late. Three genes expressed early (J-L) showed unique temporal patterns. The heat map is based on log2 fold-changes from the geometric mean for each gene, with coloring based on 10th and 90th percentile fold-change values for the whole data set
