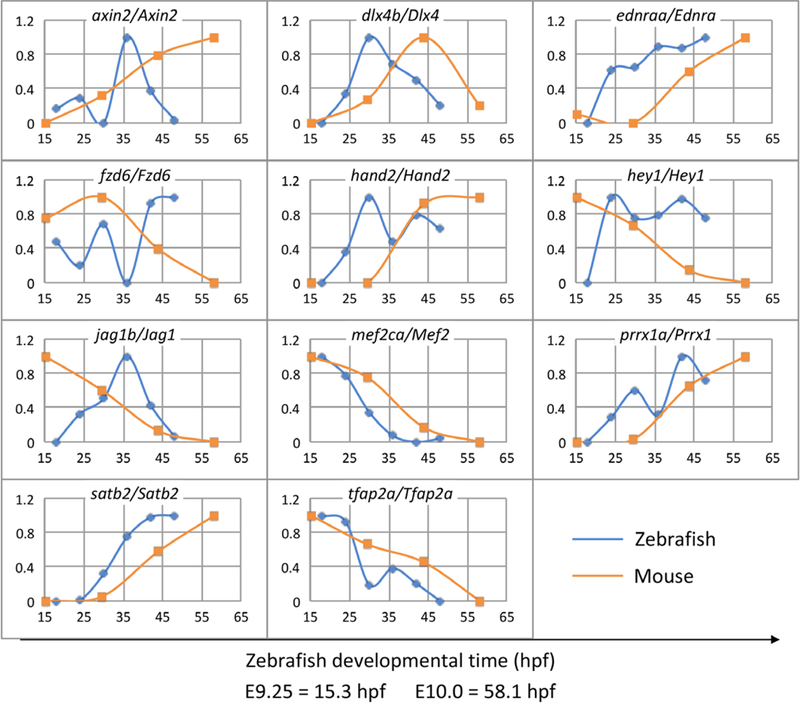
FIGURE 7.

Computational correspondence between timing of zebrafish and mouse arch patterning gene expression. Algorithmic alignment of 11 genes with highly dynamic temporal expression profiles in the arches. Global alignment is: E9.25 = 15.3 hpf/E10.0 = 58.1 hpf. The x-axis shows development time in hpf units on a common scale. The y-axis shows normalized gene expression levels. Expression levels are normalized to 1 for maximum and 0 for minimum
