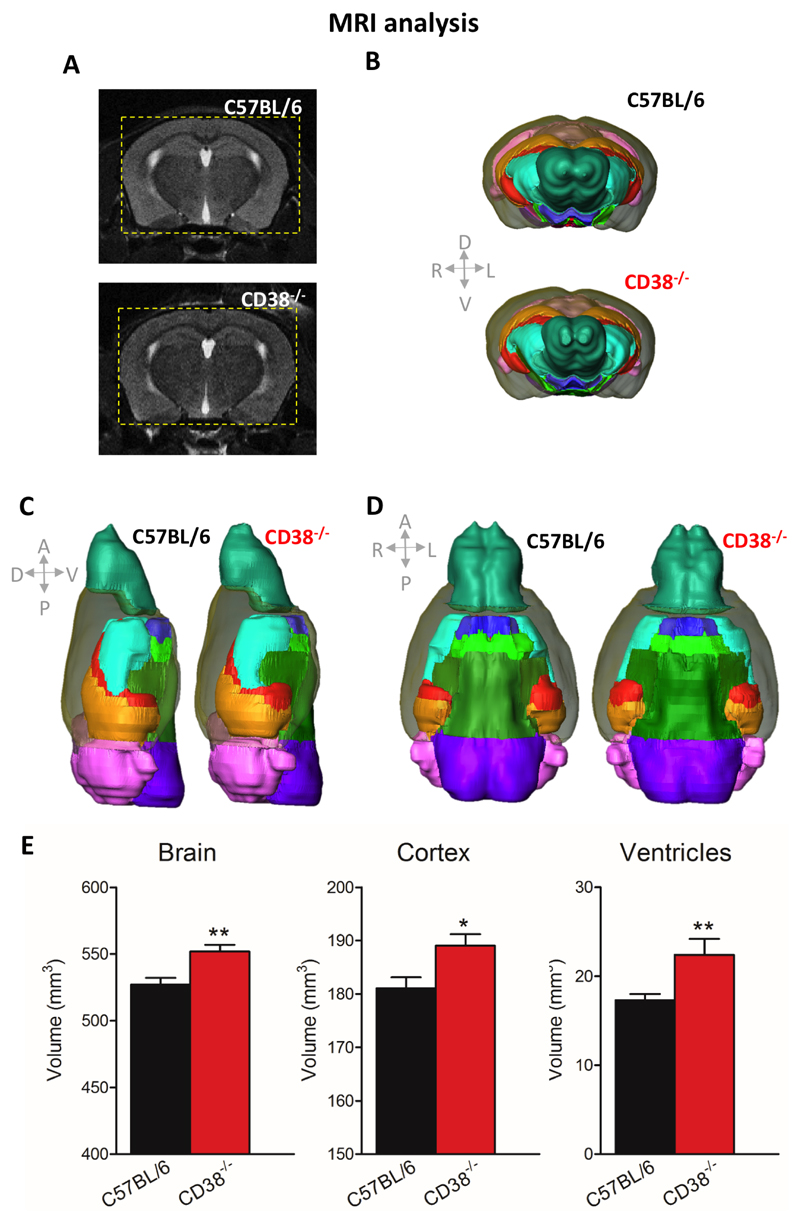
Figure 1. Alteration of brain volumetric integrity in CD38-/- male mice evaluated by MRI.
(A) Sample MRI coronal images (top, C57BL/6 mouse; bottom, CD38-/- mouse), corresponding to 2D cutting planes. To better highlight the difference between genotypes, dotted yellow squares were drawn on both images to outline the size of the CD38-/- mice brain compared with the C57BL/6 brain size. (B, C, D) 3D reconstructions of mouse brains with brain regions delineated according to mouse brain atlas (left C57BL/6; right CD38-/- mice), showing significant differences in brain gross anatomy between C57BL/6 mice and CD38-/- mice. Brain regions considered in the analysis are represented by distinct colours as follows: ventricles, red; cortex, grey ; hippocampi, orange; ventral structures, green ; striatum, turquoise ; olfactory bulbs, blue-green ; cerebellum/colliculus, pink and purple. (E) Histograms of estimated volumes in cubic millimetres of the total brain, cortex and ventricles (C57BL/6, n = 9 mice; CD38-/- mice, n= 10 mice). Error bars represent S.E.M., Mann-Whitney, two tailed (*p<0.05; **p<0.01).

