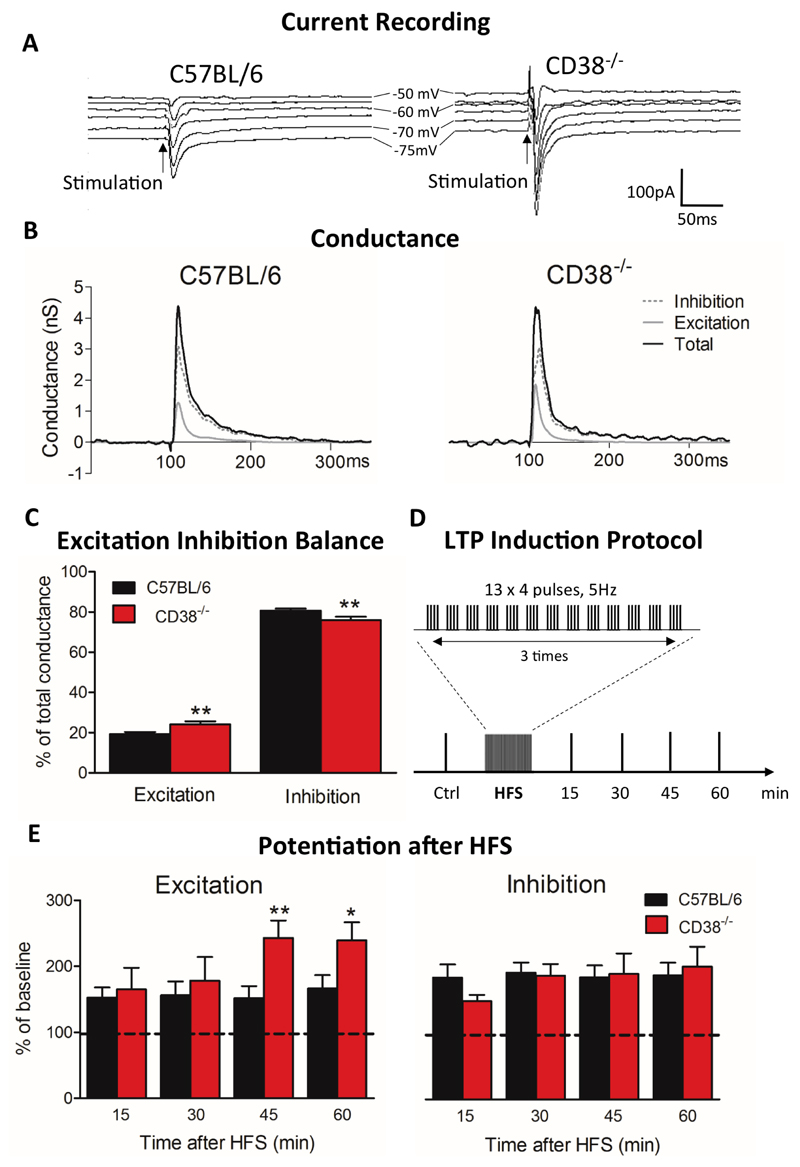
Figure 2. Impaired E-I balance in the PFC of CD38-/- male mice.
(A) Representative current responses in a L5PyN following layer 2/3 stimulation in PFC of a C57BL/6 mouse (left column) and of a CD38-/- mouse (right column), recorded under voltage-clamp at various holding potentials (each response is the mean of 5 recordings). Vertical arrows indicate stimulation onset. (B) Corresponding total conductance changes (black line). Changes in excitatory conductance (light grey line) and inhibitory conductance (dotted dark grey line) derived from total conductance decomposition (see Material and Methods). (C) Histograms of the E-I balance. The E-I balance changed significantly in CD38-/- mice (n=25 cells, 13 mice) compared with C57BL/6 mice (n=43 cells, 21 mice). Mann-Whitney, two tailed (**p<0.01). (D) LTP induction protocol by HFS. (E) LTP induced in L5PyNs from C57BL/6 mice (n=11 cells, 8 mice) and CD38-/- mice (n=8 cells, 5 mice) at 15 min, 30 min, 45 min and 60 min after the HFS protocol. Histograms represent relative changes compared to control (0 min, before HFS) in excitatory (IntgE, left panel) and inhibitory (IntgI, right panel) conductances. Error bars represent S.E.M., Mann-Whitney, one-tailed (*p<0.05; **p<0.01).

