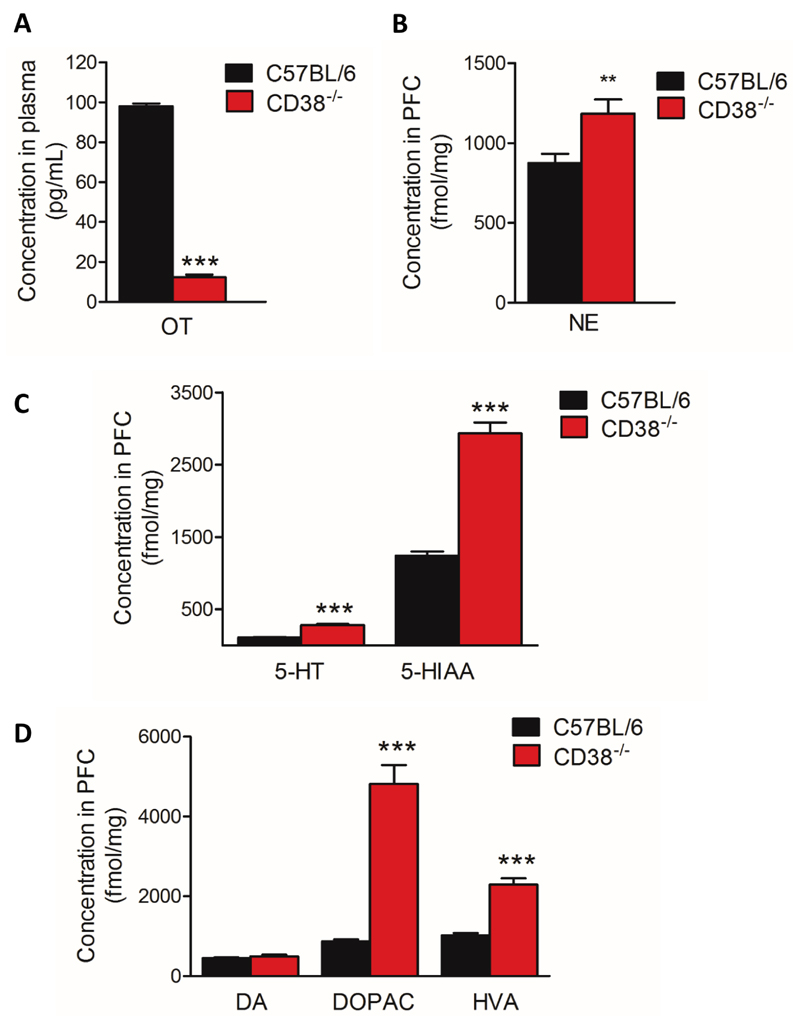
Figure 6. Alteration of endogenous neurochemical levels in CD38-/- male mice.
(A) Plasma levels of OT. (B) PFC endogenous content of NE in C57BL/6 mice and CD38-/- mice. (C) PFC endogenous content of 5-HT and 5-HIAA in C57BL/6 and CD38-/- mice. (D) PFC endogenous content of DA, DOPAC and HVA in C57BL/6 and CD38-/- mice. C57BL/6 mice, n=10 mice; CD38-/- mice, n=10 mice. Error bars represent S.E.M. Statistical analysis using Mann-Whitney, two-tailed (*p<0.05; **p<0.01; ***p<0.001).

