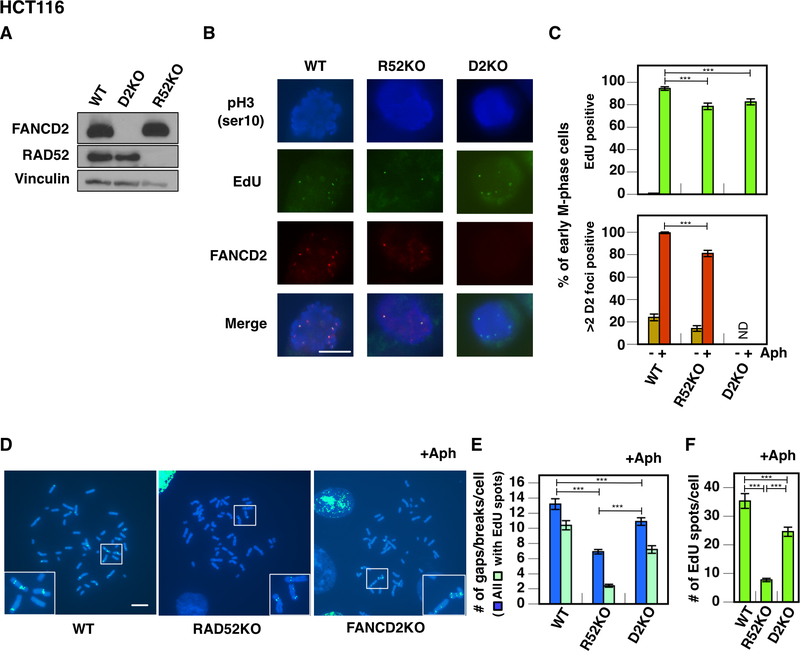
Figure 1. FANCD2 promotes mitotic DNA synthesis in addition to RAD52 in HCT116 cells.
A. Immunoblotting to confirm the lack of FANCD2 and RAD52 in respective mutant lines (D2KO and R52KO) along with expression levels of these proteins in parental wild-type (WT) cells. Vinculin was used as a loading control. B. Representative images of phospho-H3 stained nuclei/chromosomes (blue), EdU spots (green), and FANCD2 (red) foci are displayed for each genotype. C. Percentage of early M-phase (prophase to prometaphase) cells positive for EdU spots (top) or >2 FANCD2 foci (bottom) in the presence/absence of Aph treatment for each genotype. D. Representative images of metaphase spreads that display Aph-induced EdU spots and/or gaps/breaks in each genotype. E. The average number of gaps/breaks for each genotype and those found at EdU spots per cell. F. The average number of EdU spots for each genotype. Error bars indicate standard deviations of respective frequencies in C and standard errors of means in E and F, respectively. *** indicates p<0.001 by a χ2-test in C and by a t-test in E and F, respectively. Bars in microscope images in B and D indicate 10 μm. ND; none detected.

