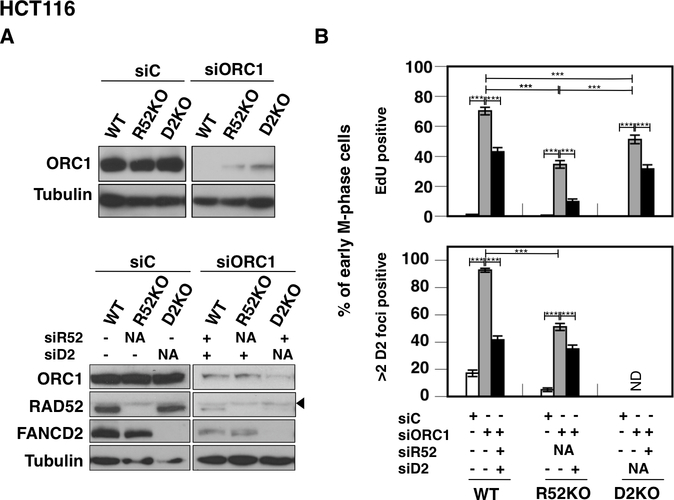
Figure 2. FANCD2 and RAD52 act in parallel in supporting EdU spot formation under ORC1 depletion in HCT116 cells.
A. Immunoblotting to show depletion of ORC1 (top/bottom) in all genotypes and additional depletion of RAD52 and/or FANCD2 (bottom) in respective HCT116 genotypes. Tubulin was used as a loading control. A filled triangle indicates a non-specific band detected by the RAD52 antibody. B. Percentage of early M-phase cells positive for EdU spots (top) or >2 FANCD2 foci (bottom) after ORC1 depletion in combination with RAD52 and/or FANCD2 depletion. Error bars indicate standard deviations of respective frequencies. *** indicates p<0.001 by a χ2- test. ND; none detected. NA; not applicable.

