Figure 1.
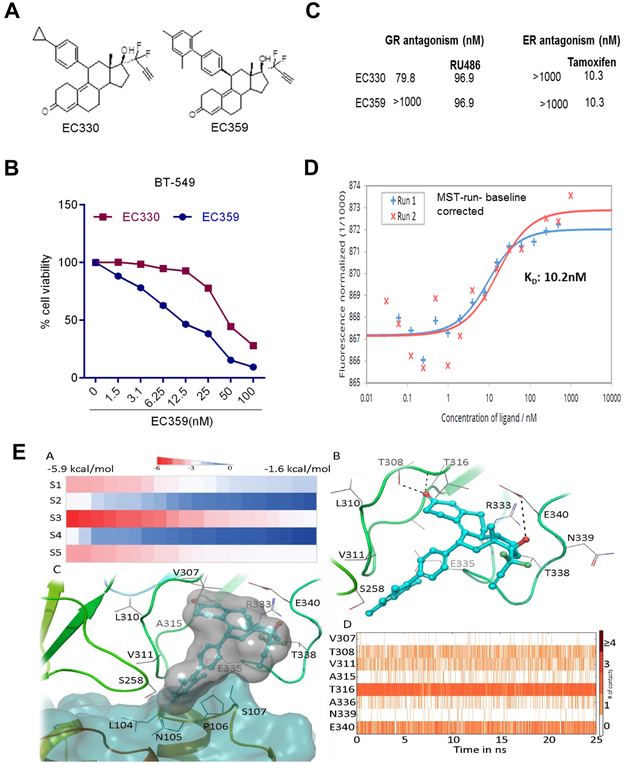
Characterization of EC359. A, schematic representation of structure of EC330 and EC359. B, Dose response curve of EC330 and EC359 determined using MTT assay on BT-549 cells (n=3). C, Ability of EC359 to interact with other steroid receptors were analyzed by in vitro binding assays. D, Binding of EC359 to LIFR was confirmed using MST assays as described in methods. EA: The docking scores of EC359 at different binding sites. The sites were mentioned as S1 to S5. EB: Binding of EC359 (represented in blue ball and stick model) with hLIFR (represented in cartoon and line model). The dotted lines representing the hydrogen bonds. EC: The binding of EC359 in the presence of LIF (represented in blue surface). The binding creates close contacts with residues of LIF. ED: The protein ligand contacts over a 25 ns of MD.

