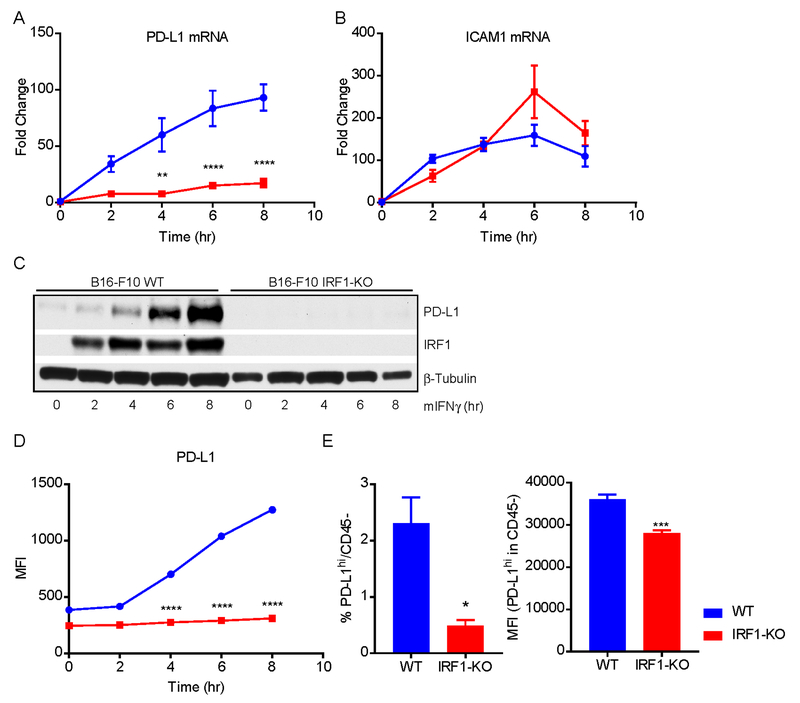
Fig. 4: PD-L1 expression in vitro and in vivo is specifically affected by IRF1 loss.
B16-F10 WT and IRF-1 KO cells were treated with mouse IFNγ for 0, 2, 4, 6 and 8 hrs, and collected for the detection of expression of PD-L1. (A-B) The mRNA expression of PD-L1 and ICAM1 were detected using TaqMan real-time PCR. (C) Total protein expression of PD-L1 was examined by immunoblotting. (D) The cell surface expression of PD-L1 was assessed by flow cytometry. (E) 5 × 10⁵ of B16-F10 WT or IRF1-KO cells were intradermally injected into C57BL/6 mice (n=5). Tumor were collected on day 12 of post-injection. The percentage of and geometric mean (MFI) of PD-L1high in CD45− cells (tumor cells) were tested by flow cytometry. In (A) and (B) each data point represents mean and SEM from 3 independent replicates. Representative results from twice repeated experiment are shown in (C - F).

