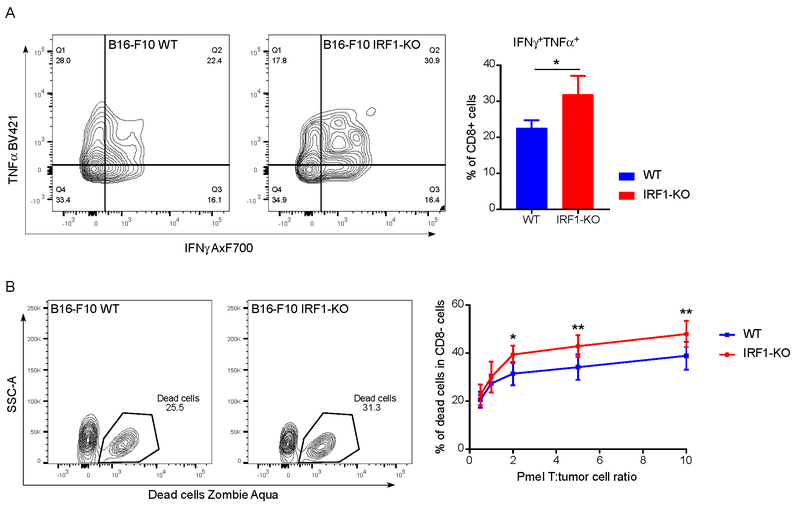
Fig. 5: IRF1 deficient tumor cells affect infiltrating T cell functions ex vivo and are more vulnerable to CD8+ T-cell cytotoxicity in vitro.
(A) Intracellular cytokine production of infiltrating CD8+ T cells in B16-F10 WT and IRF1-KO tumors (n=9, 8). Single cell suspension was prepared after tumor collection. The mixture of tumor cells and infiltrated lymphocytes was stimulated overnight with PMA and ionomycin, then cytokine secretion was blocked with GolgiPlug™ for 4 hrs. Representative flow-cytogram for intracellular cytokine expression is shown. For each type of cytokine expression, cumulative mean and SEM were plotted from twice repeated experiments, statistical significance was calculated by unpaired student t test, and presented as * P < 0.05. (B) The percentage of dead tumor cells at different Pmel T : tumor cell ratios. 10,000 tumor cells in each 96-well plate were cocultured with different amount of Pmel CD8+ T cells overnight. Cells were harvested and examined for viability using Zombie Aqua Fixable Viability Kit. The experiment was repeated 3 times. For each data point mean and SEM from twice repeated experiments were plotted, statistical significance calculated by two-way ANOVA with Sidak’s multiple comparison test, and presented as * P < 0.05, ** P < 0.01.

