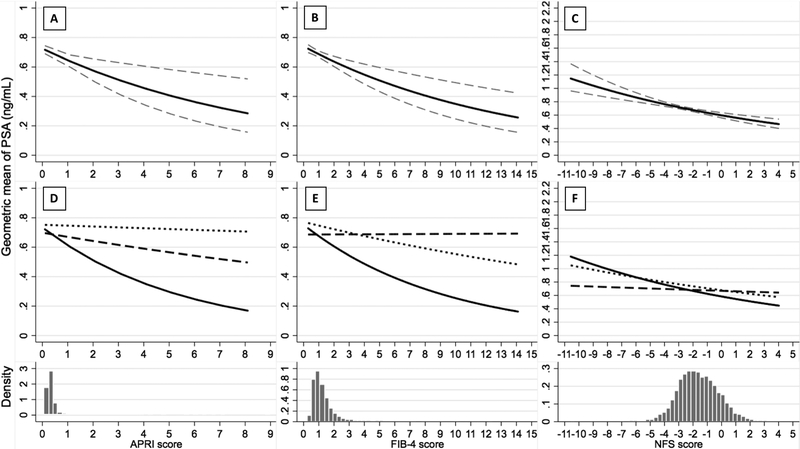
Figure 1. Association between Fibrosis Scores and Geometric Mean PSA Serum Concentration (ng/mL) Overall (Panel A, B, C) and By Race/Ethnicity (Panel D, E, F) Among Men 40 Years and Older, NHANES 2001–2010.
In panels A, B and C, the solid line indicates the estimated geometric mean of PSA, while the dash line indicates the 95% CI of the estimated geometric mean of PSA. The histogram below each panel displays the density distribution of APRI, FIB-4, and NFS score, respectively. In panels D, E and F, the solid line indicates the estimated geometric mean of PSA among non-Hispanic Whites, the dash line indicates non-Hispanic Blacks, and the dot line indicates Mexican American/other Hispanics. The x-axis ranges represent the true ranges of fibrosis scores among the analyzed population. The p values for the interaction between race/ethnicity and APRI, FIB-4 and NFS are 0.235, 0.002 and 0.004, respectively.

