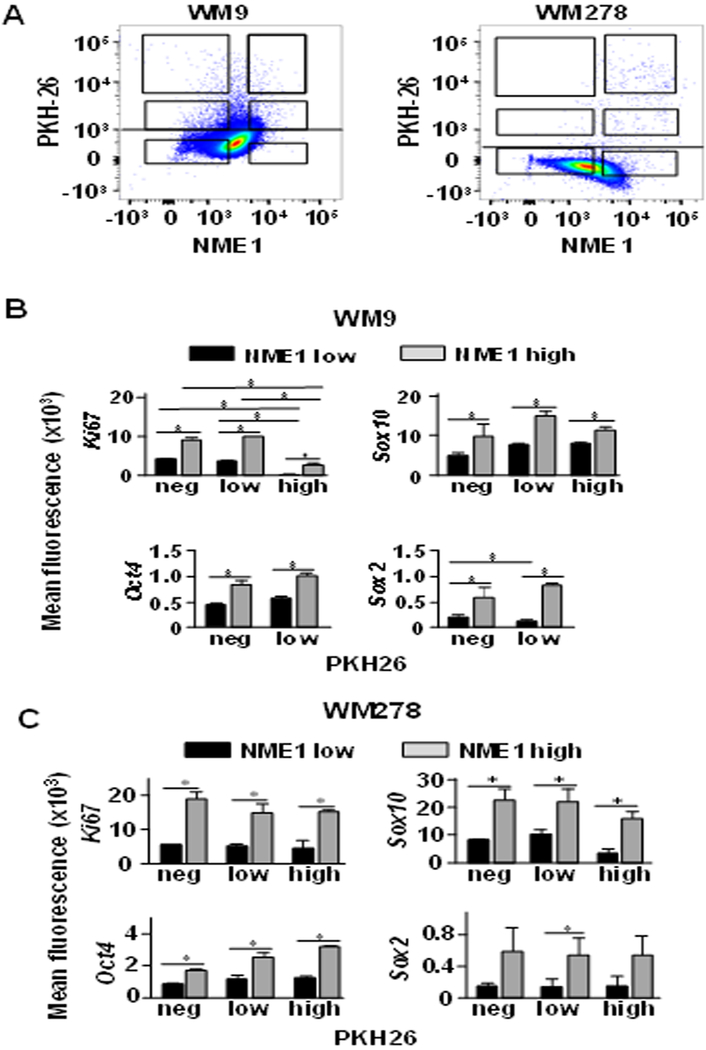
Figure 3.
Melanoma sphere cultures contain subpopulations of proliferative cells that exhibit increased expression of NME1 and stem cell markers. Melanoma spheres were grown for 21 d after labeling with PKH26 and analyzed by flow cytometry after staining with antibodies specific for NME1, stem cell markers (Sox2, Sox10, Oct4) and Ki67. A, Dot plot gatings based on levels of NME1 and PKH26 dye retention in WM9 (left) and WM278 (right) sphere cells. B and C, Mean fluorescence of stem cell markers and Ki67 staining for the gated populations from sphere cells of panel A. B, WM9; panel C, WM278. Means ± SEM derived from cumulative data of three independent experiments are shown. * P<0.05.

