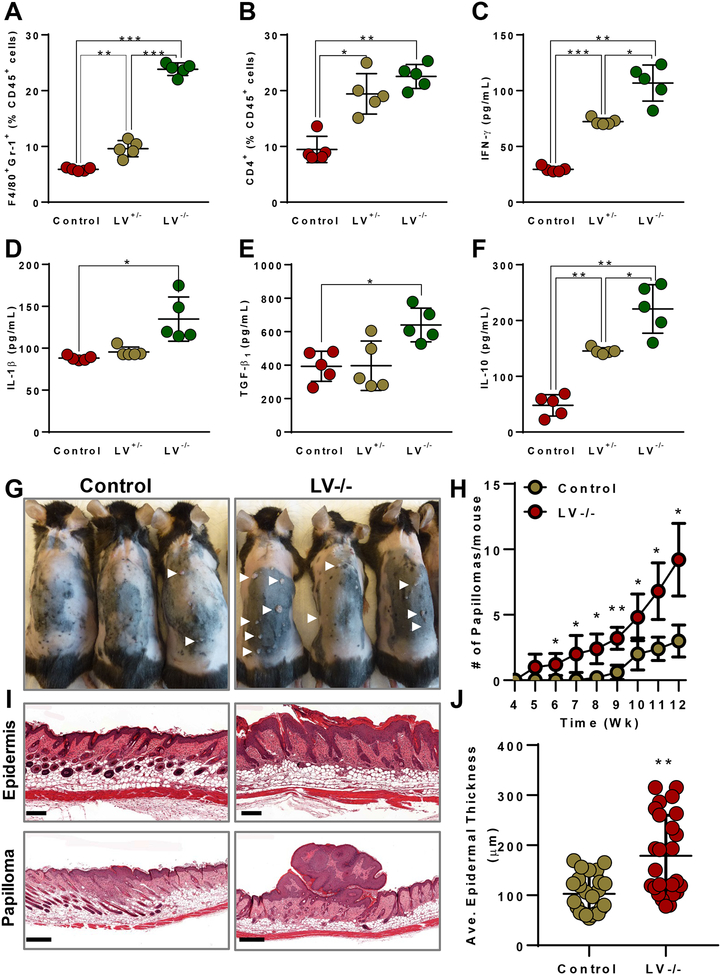
Figure 7. Lymphatic ablation causes increased inflammation independent of tumors and causes increased spontaneous tumors.
Flow cytometry quantification of (A) CD45+F4/80+Gr-1+ MDSCs and (B) CD4+ T cells. Quantification of concentrations of the inflammatory cytokines (C) IFNγ and (D) IL1β; and the immunosuppressive cytokines (E) TGFβ1, and (F) IL10. N=5 per group, mean ± SD, one-way ANOVA with Tukey’s multiple comparisons test for all. (G) Photographs of mice showing spontaneous skin tumors (papilloma) at after 12 weeks of TPA treatment. (H) Quantification of number of papillomas. (I) Histology of skin showing epidermal thickness (upper, Scale 200 μm) and papilloma (lower, Scale 500 μm). (J) Quantification of average epidermal thickness between groups. N=5 per group, mean ± SD, unpaired student’s t-test. *P<0.05, **P<0.01, ***P<0.00

