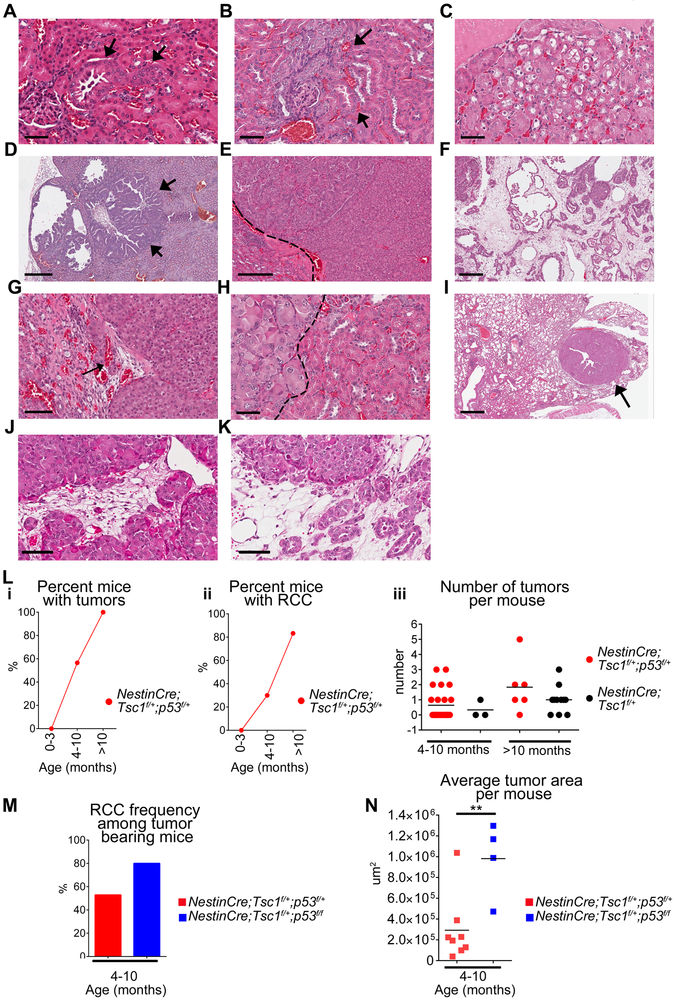
Figure 1. Renal tumorigenesis induced by partial loss of Tsc1 and p53 in a non-inducible mouse model.
(A-K) Hematoxylin and eosin (H&E) stained kidney sections of (A-C, E-K) of NestinCre;Tsc1f/+;p53f/+ and (D) NestinCre;Tsc1f/+;p53f/f kidneys; scale bars 50μm.
(A-C) renal intraepithelial neoplasia (RIN)-arrows.
(D-F) (D) papillary (arrows), (E) chromophobe and (F) collecting duct RCC; scale bars 50μm
(G-I) (G) invasion of blood vessels (arrow), (H) high atypia; (I) lung metastasis; Dash lines-border between tumor and benign kidney; scale bars 50μm.
(J-K) Areas containing large polygonal cells with clear cytoplasm and hyperchromatic nuclei; scale bars 50μm.
(L-N) The tumor burden in mouse cohorts: (L-i) invasive RCC and RIN, (L-ii-iii, M-N) invasive RCC.
Data represent means±SEM. **P≤0.01,t-test; nNestinCre;Tsc1f/+;p53f/+=38, nNestinCre;Tsc1f/+;p53f/f =13, nNestinCre;Tsc1f/+=14.

