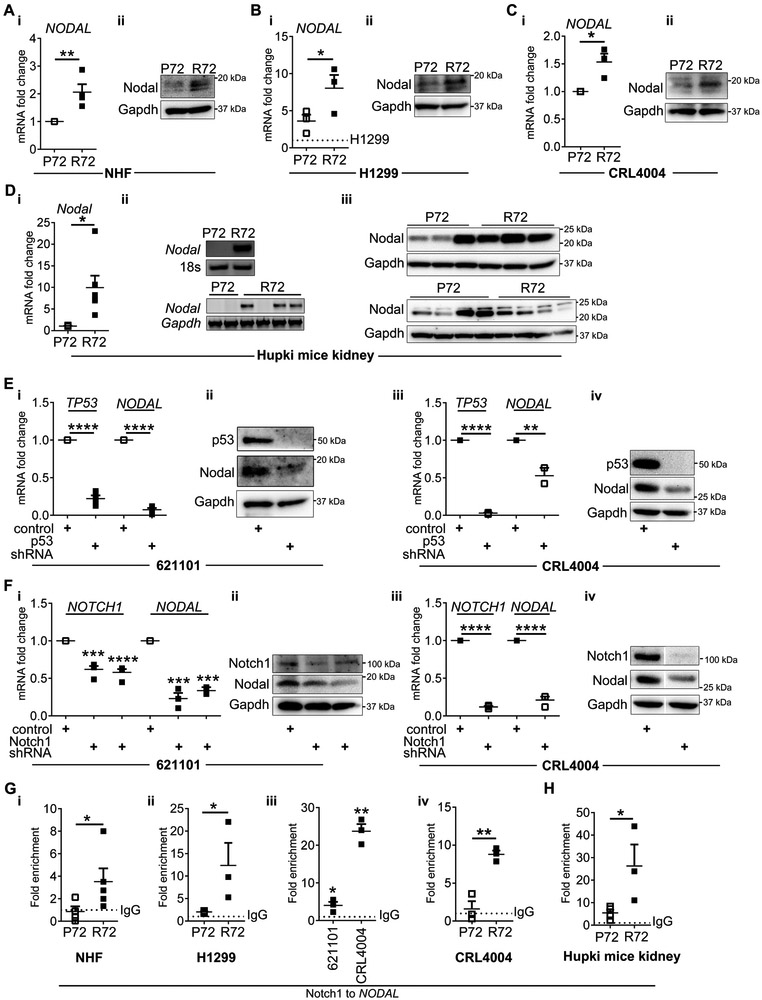
Figure 4. R72- and Notch1-dependent expression of Nodal.
(A-D) Expression of Nodal in P72 and R72 (A) NHF, (B) doxycycline treated H1299 cells (dotted line- expression of Nodal in non-treated H1299 cells), (C) P72 and R72 CRL4004 angiomyolipoma cells and (D) kidneys of P72 and R72 mice by (A-i, B-i, C-i, D-i) q(RT)-PCR relative to GAPDH followed by (D-ii) gel detection and (A-B-C-ii, D-iii) Western immunoblotting. The loading control in D-iii is also shown in second panel of 3F-ii and 6A-ii.
(E-F) Expression of (E) TP53 and NODAL or (F) NOTCH1 and NODAL in (E-i-ii, F-i-ii) 621–101 and (E-iii-iv, F-iii-iv) CRL4004 angiomyolipoma cells, depleted of (E) p53 or (F) Notch by (E-i, iii, F-i, iii) q(RT)-PCR relative to GAPDH and (E-ii, iv, F-ii, iv) Western immunoblotting. The loading control (Gapdh) and p53 immunoblot in E-ii and E-iv are also shown in 3D-ii and 3E-ii, respectively. The same control cell line was used and run simultaneously for experiments in E-F-iv, therefore the same Nodal and Gapdh immunoblots are shown in E-F-iv.
(G-H) Binding of Notch1 to the NODAL promoter by ChIP-qPCR in (G-i) P72 and R72 NHF cells, (G-ii) P72 and R72 H1299 cells treated with doxycycline, (G-iii) 621–101 and CRL4004 angiomyolipoma cells, (G-iv) P72 and R72 CRL4004 angiomyolipoma cells, and in (H) kidneys of R72 and P72 mice shown as fold enrichment over the IgG (dotted line).
Data represent means±SEM. *P≤0.05, **P≤0.01, ***P≤0.001, ****P≤0.0001.
Data are representative of four, n=4 (A), three, n=3 (B-C, E, F), n=8 (D-i-ii) and n=14 (D-iii) animals, two n=5 (G-i-ii), n=3 (G-iii-iv, H) independent experiments.

