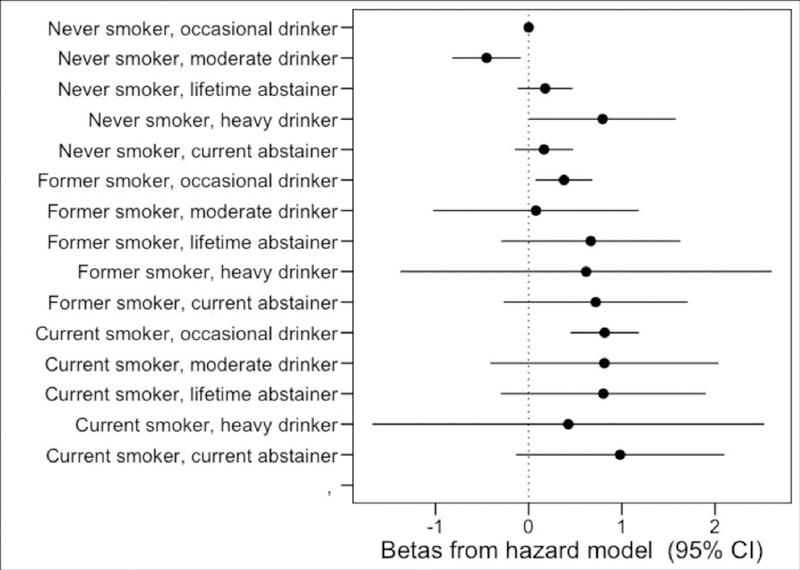
Figure 2.

Predicted mortality hazard differences based on the interaction of average drinking status across waves and average smoking status across waves in a longitudinal sample of adults over 56 in the United States (N=7,904). Referent group for each hazard ratio is never smoker/occasional drinkers. Hazard differences derived from a Cox proportional hazard model with and interaction term between alcohol consumption and smoking (P<0.01 for the interaction), an interaction term between alcohol consumption and gender, and the following covariates: gender, age at baseline, race, wealth, smoking, BMI, difficulties in activities of daily living, depressive symptoms based on Center for Epidemiologic Studies Depression Scale (CES-D), arthritis since previous wave, cancer since previous wave, diabetes since previous wave, heart disease since previous wave, stroke since previous wave, high blood pressure since previous wave, lung disease since previous wave, and psychiatric problem since previous wave.
