
Figure 3. (TG)-dinucleotide repeats recapitulate structure formation, high breakage rate, orientation-dependence, and deletion spectrum.
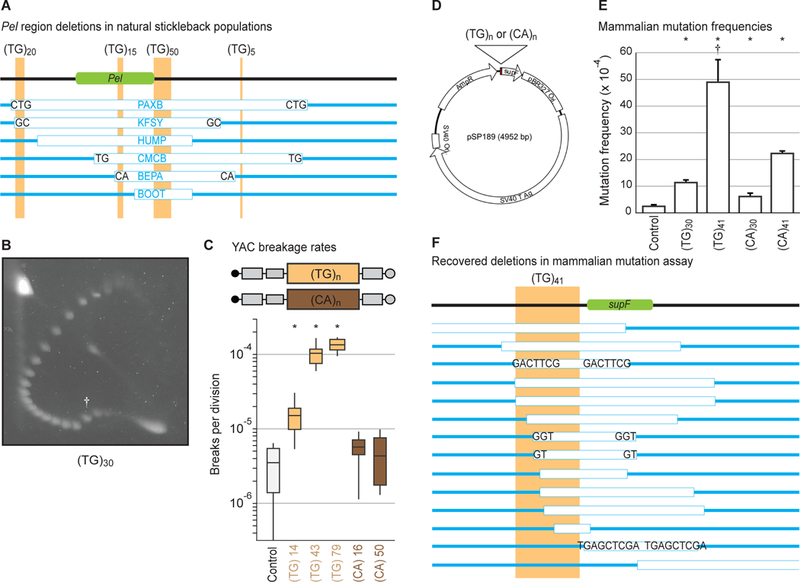
(A) To-scale maps of Pel in different freshwater pelvic-reduced populations (table S6). Green, Pel sequence driving pelvis expression (6). Light-brown, TG-repeats. White boxes, DNA deletions in indicated populations. Blue, DNA remaining. Letters, microhomologies at deletion junctions. (B) Two-dimensional gel for (TG)30. Dagger, mobility shift. (C) Yeast artificial chromosome breakage rates for TG- or CA-repeats of varying lengths. *p < 0.01 (table S5). (D) Reporter shuttle plasmid schematic. (E) Mammalian mutation frequencies. Error bars indicate SEM of 4–5 independent experiments. *p < 0.05 (Student’s t-test). Dagger, deletions dominate mutation spectrum (fig. S2A). (F) To-scale map of (TG)41-induced deletions in mammalian cells.