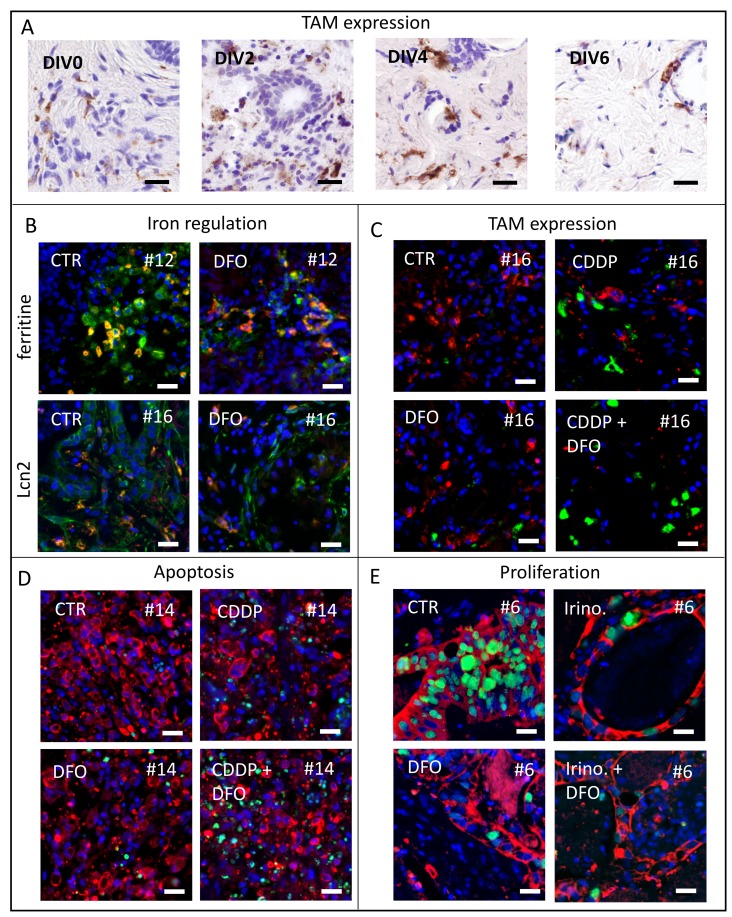
Figure 1. Representative pictures of analyzed human tumor slice cultures.
(A) To investigate macrophage survival we use CD68 antibody staining for TAM in vitro after 0, 2, 4, 6 DIV of gastric cancer specimens. (B) Representative images of ferritin expression (green) and co-located TAM (CD68, red) after 4 DIV in control and DFO treated conditions of specimen #12 and representative images of Lcn2 expression (green) and co-located TAM (CD68, red) after four DIV in control and DFO treated conditions of specimen #16 (Hoechst, blue). (C) Representative pictures of macrophage phenotypes (CD68, red; CD163, green) expression after treatment at four DIV in specimen #16 (Hoechst, blue). (D) Representative images of apoptotic tumor cell fraction (Hoechst, blue; AE 1/3, red; cPARP, green) of specimen #14. (E) Representative images of proliferating tumor cell fraction (Hoechst, blue; AE 1/3, red; Ki67, green) of specimen #6. (Bars 20 μm).

