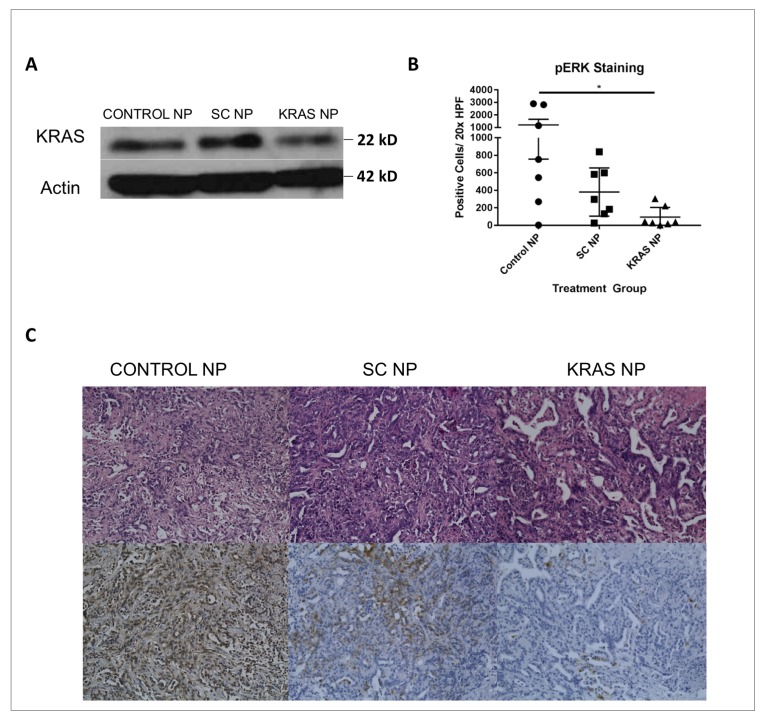
Figure 5. Tumors treated with KRAS siRNA NP demonstrate knockdown of the KRAS signaling pathway.
(A) KPC-1 tumors from mice treated with KRAS-siRNA NP exhibit diminished KRAS protein level by Western blot analysis compared to scramble siRNA NP treated animals. (B) Looking at KPC-1 tumors from 7 mice/ group, with 5 20x images/ HPF taken, there was significant knockdown of pERK demonstrated in KRAS-siRNA NP (KRAS NP) treated mice. (C) H&E (top), and pERK IHC (bottom) images from control, scramble siRNA NP (SC NP) and KRAS NP treated mice. *=p < 0.05, standard error of the mean (SEM) shown.

