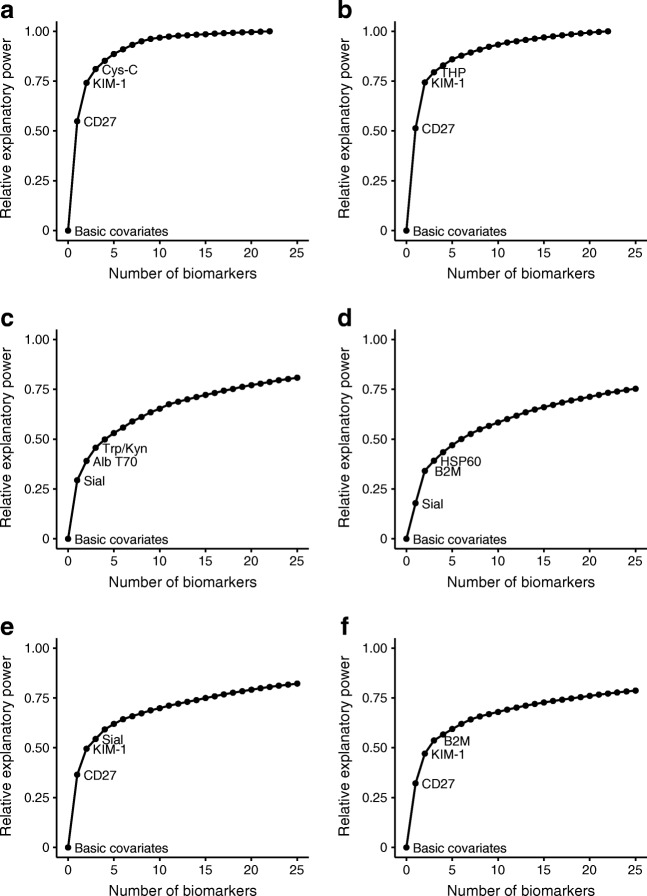
Fig. 1.
Contribution of biomarker sets to prediction of achieved eGFR when starting from a model containing only age, sex, diabetes duration, study day eGFR and length of follow-up (basic covariates) in SDRNT1BIO (a, c, e) and FinnDiane (b, d, f). The sets of biomarkers added were: (a, b) Luminex platform; (c, d) LC-MS/MS platform; (e, f); both platforms together. Note that for (c) to (f) the plotting of the curve was interrupted after 25 biomarkers: by definition, the curve would gradually converge to 1 with the addition of all remaining biomarkers. The names of the ten highest ranking biomarkers in each setting are provided in ESM Table 5. Alb T70, albumin T70; B2M, β-2-microglobulin, Cys-C, cystatin C, HSP60, heat-shock protein 60 kDa; Sial, free sialic acid; THP, Tamm–Horsfall urinary glycoprotein; Trp/Kyn, tryptophan/kynurenine

