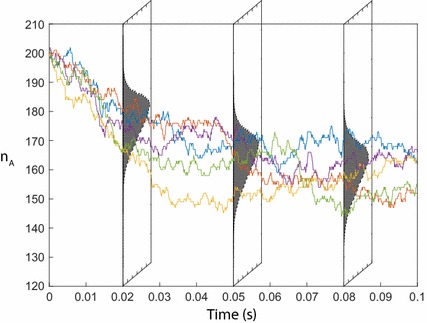
Fig. 2.

Stochastic simulations and analytical solutions of Eq. (10). The five multicoloured trajectories are independent simulations made using the SSA. Exact probability distributions solving Eq. (10) are shown as perpendicular grey histograms at , 0.05 and 0.08. This makes clear that at each time point t the numerical value of each trajectory is a sample from the probability distribution solving the CME
