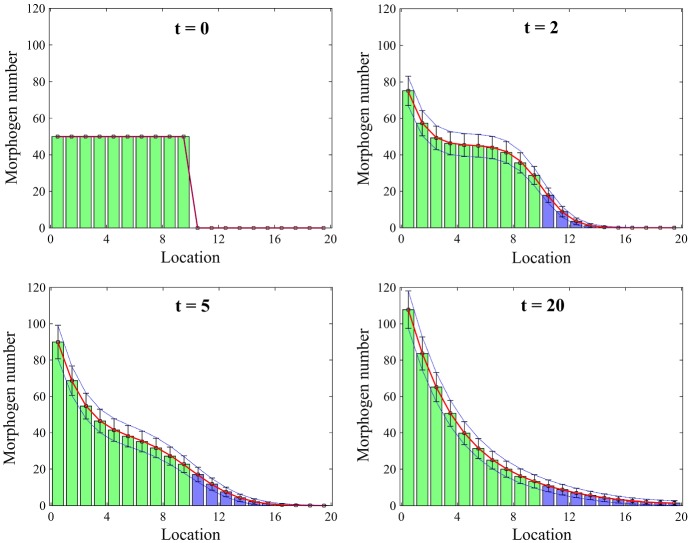
Fig. 3.
Comparison between mean numbers of morphogens and their standard deviations from the mean using the analytic solution (red lines and blue dotted lines) and Scheme 1 (green bars and blue bars for the means in and , respectively, and error bars for the standard deviations) (Color figure online)

