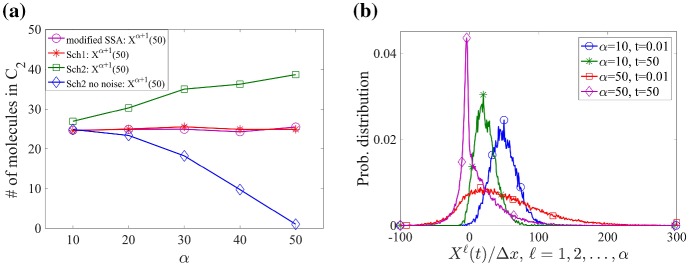
Fig. 5.
a The mean number of morphogens in at time . Different simulation methods are compared with , 20, 30, 40, 50: the Gillespie SSA with multigrid discretization ( grid points with size and one grid point with size h), Scheme 1, Scheme 2 and “Scheme 2 with no noise” due to diffusion in . b The probability distribution of the normalized morphogen number in with Scheme 2. The probability distributions are computed for , and compared among the cases with , 50 at time , . Initially, 50 molecules are located in in panels (a, b) (Color figure online)

