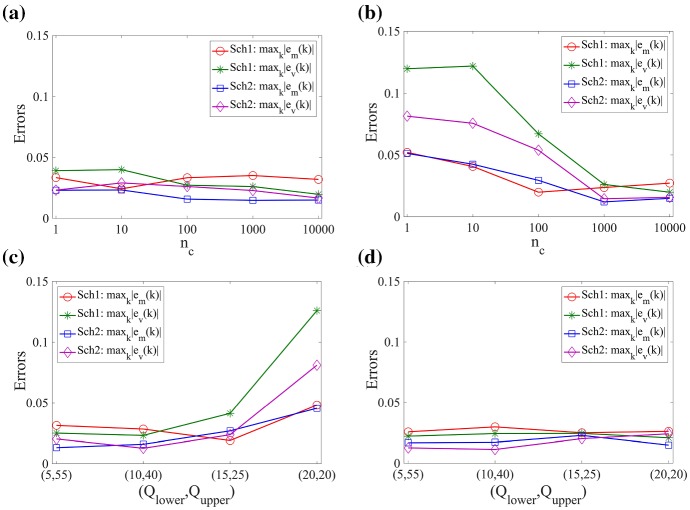
Fig. 7.
The maximum absolute values of the errors defined by Eq. (13) at time using the multiscale algorithms, with a moving boundary. Different values of , 10, , , , are used with fixed thresholds a and b. Different threshold values , (10, 40), (15, 25), (20, 20) are used with, c and d. Red and green lines are the maximal relative errors of the means and standard deviations between the analytic solution of the Markov chain model and Scheme 1, given by Eq. (13). Blue and Purple lines are maximal relative errors between the Markov chain model and Scheme 2, given by Eq. (13) (Color figure online)

