Figure 2.
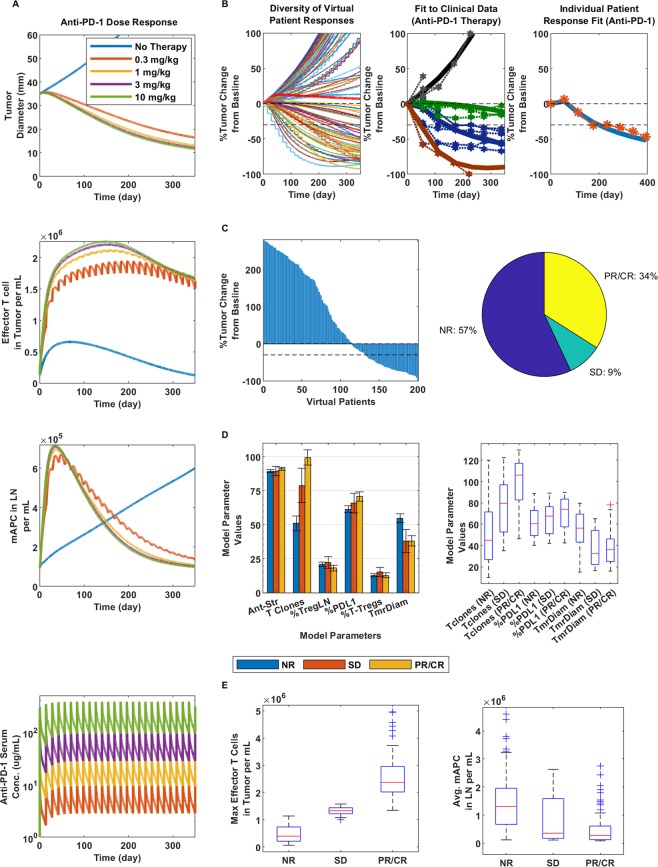
Dose response and clinical validation of anti-PD-1 monotherapy. (A) From top to bottom: Tumor response to anti-PD-1 therapy at doses of 0.3, 1, 3 and 10 mg/kg as represented by the colors in the bottom figure in ascending order; the blue line indicates no therapy (top figure). Then, effector T cell density in the tumor (second from the top), mAPC density in the lymph nodes (third from the top) and finally, the PK of anti-PD-1 at the given doses. For all following figures, 3 mg/kg anti-PD-1 was used, following the same regimen. (B) Diversity of tumor response (left), fitting to pooled means patient response data (center) and individual patient fit (right); all at 3 mg/kg anti-PD-1. (C) Waterfall plot of VPs (left) and pie chart (right) with percent of virtual non-responders (NR), stable disease (SD) and partial or complete responders (PR/CR). (D) Bar graph comparison of parameters varied in model for each responder type (left) and box plots of significant differentiators (right). (E) Max effector T cell density in the tumor (left) and average mAPC density in the lymph nodes (right) for each responder category.

