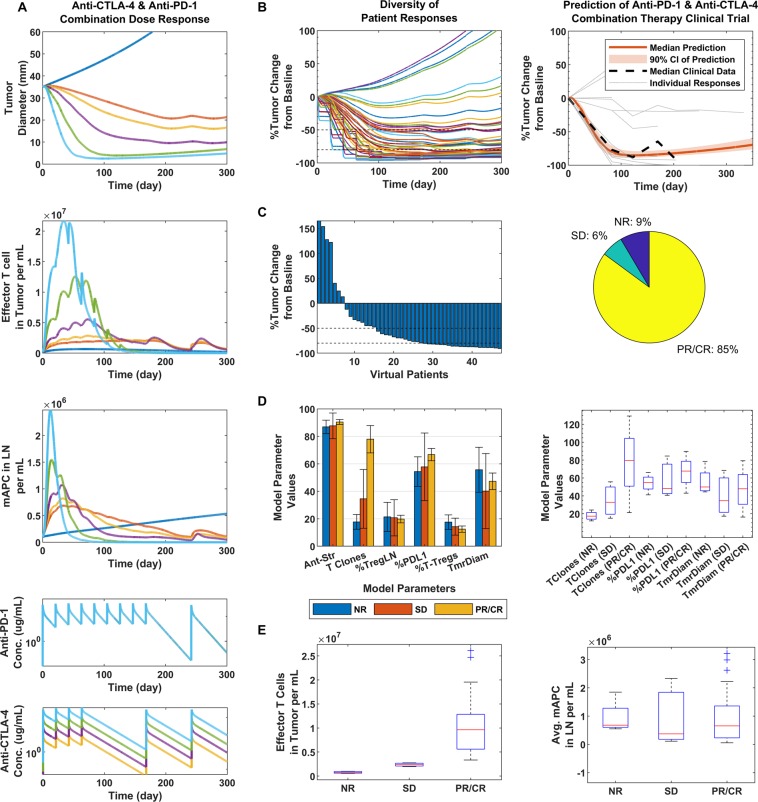
Figure 3.
Dose response and clinical validation of anti-PD-1/anti-CTLA-4 combination-therapy. (A) From top to bottom: Tumor response to combination therapy at doses of 0.3, 1, 3 and 10 mg/kg of anti-CTLA-4, as represented by the colors in the bottom figure in ascending order and 3 mg/kg for anti-PD-1 was used for all simulations; the blue line indicates no therapy (top figure), and orange indicates only anti-PD-1. Then, effector T cell density in the tumor (second from the top), mAPC density in the lymph nodes (third from the top) and finally, the PK of anti-PD-1 and lastly, anti-CTLA-4 at the given doses. For all following figures, 1 mg/kg anti-PD-1 and 3 mg/kg anti-CTLA-4 were used, following the same regimen. (B) Diversity of tumor response (left), prediction of median clinical response data (right). (C) Waterfall plot of VPs (left) and pie chart (right) with percent of virtual non-responders (NR), stable disease (SD) and partial or complete responders (PR/CR). (D) Bar graph comparison parameters varied in model for each responder type (left) and box plots of significant differentiators (right). (E) Max effector T cell density in the tumor (left) and average mAPC density in the lymph nodes (right) for each responder category.

