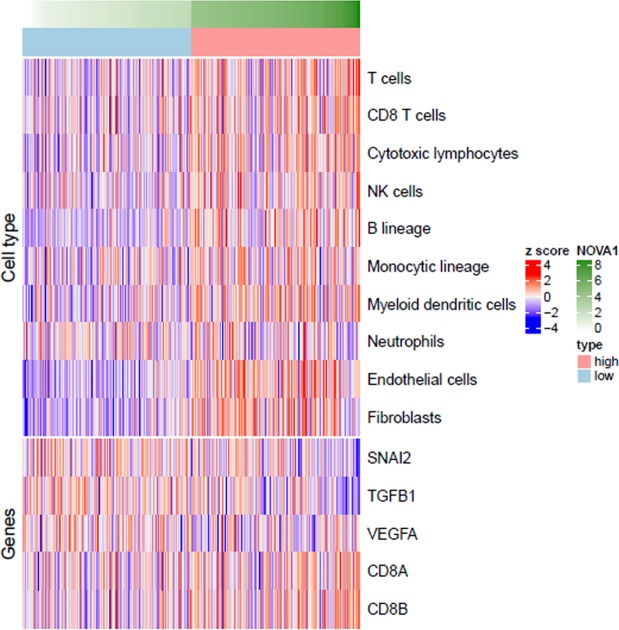
Figure 5.
Microenvironment Cell Populations-counter analysis. Z-score transformed values of log2 (normalized rsem + 1) values of genes and MCP-counter values were used to identify differences between groups for cell type abundance, inflammation-related genes, and EMT-related genes. Lower quantities of immune cells and stromal cells, downregulation of CD8+ T cell-related genes, and upregulation of SNAI2 and TGFB1 were related to low NOVA1 expression.

