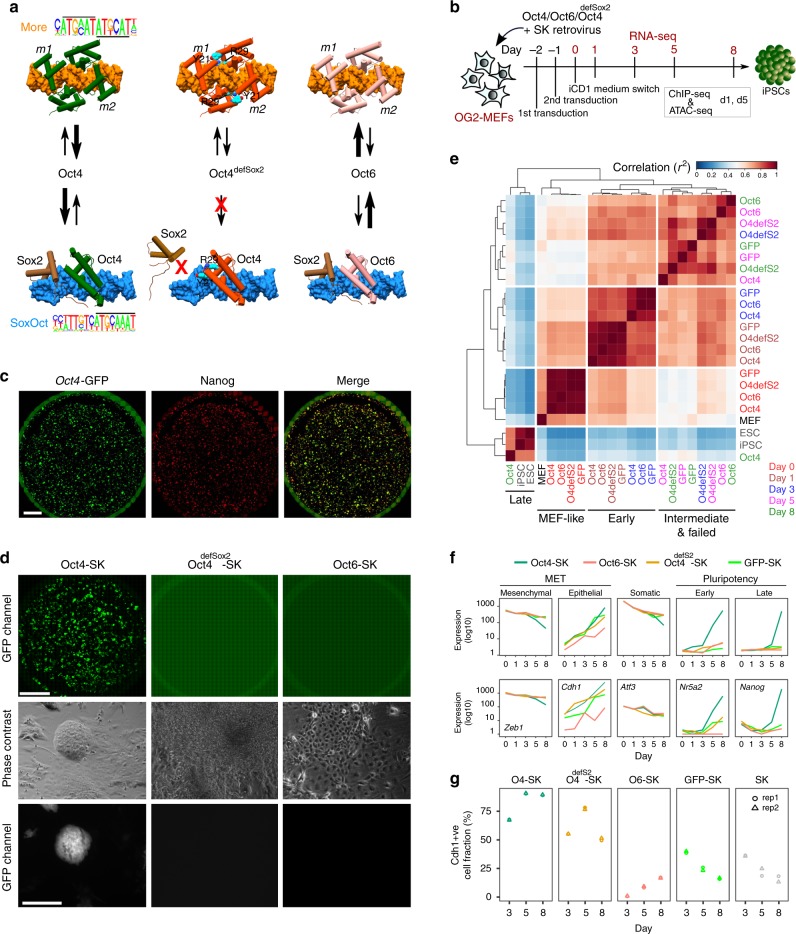
Fig. 1.
Reprogramming trajectories of cocktails containing Oct4, Oct6, Oct4defSox2, or GFP in chemically defined medium. a The cartoons represent the preferences of the POU proteins for the DNA-dependent homodimerization on MORE versus heterodimerization with Sox2 on SoxOct elements determined using quantitative biochemical assays14. MORE DNA is shown in orange and SoxOct DNA in blue; m1 is monomer 1 and m2 is monomer2. The thickness of the arrows illustrates the DNA binding preferences. b Experimental design of reprogramming and RNA-seq, ATAC-seq, and ChIP-seq experiments. c Whole-well scans from a 6-well plate using GFP channel (Oct4-GFP), Nanog immunofluorescence and merged panels; for OG2-MEF cells reprogrammed with Oct4-SK at day 8; scale 5 mm. d Whole-well scans (upper panel) of wells from 12-well plate using GFP channel for three POU factors (Oct4, Oct4defSox2, and Oct6); scale 5 mm. Representative phase contrast (middle panel) and corresponding Oct4-GFP fluorescence (lower panel) images of reprogramming experiments; time-point: day 8 post transduction; scale 200 μm. e Hierarchically clustered heatmap based on r2 correlation coefficients using RNA-seq reads as input. iPSCs and ESCs expression data are from GSE9302942. f Mean gene expression trajectories for indicated categories (upper panel) or a representative gene from each category (lower panel) in four reprogramming conditions. See Supplementary Fig. 1E for a larger panel of genes for each category. g Fraction of E-cadherin positive (Cdh1 + ve) cells at different stages of reprogramming in indicated cocktails. FACS was performed in technical duplicates (n = 2). Source data for FACS experiment are provided as a Source Data file

