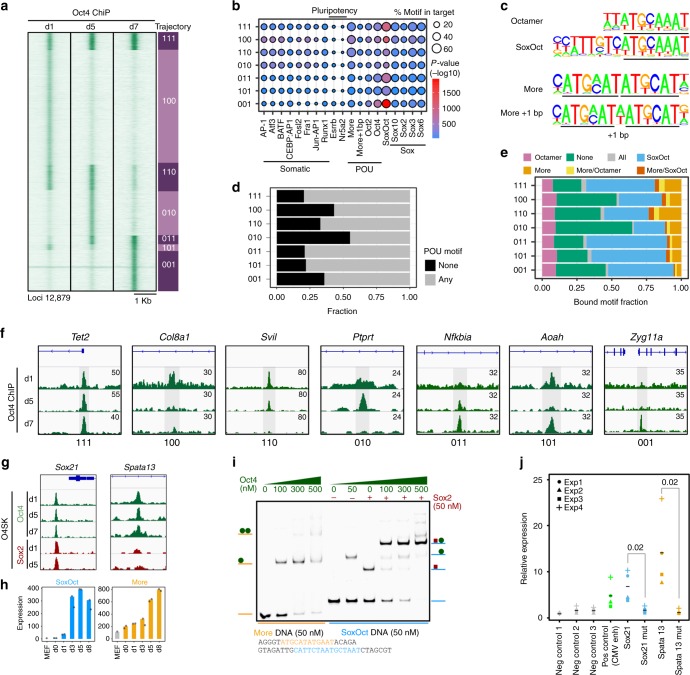
Fig. 2.
Determinants for the binding trajectories of Oct4. a Heatmap of Oct4 ChIP-seq signal within 2 kb window centered at Oct4 summits. Rows are Oct4 peaks arranged in 7 binary trajectories. 1 indicates presence and 0 absence of binding; left to right digits are days 1, 5 and 7. Summits were merged if within 100 bp. Genomic locations are provided in Supplementary Data 2. b Enrichment of selected TF motifs in Oct4 occupancy trajectories. Point size represents the proportion of sequences with the motif and color gradient (blue to red) the p-value score. c Consensus binding motifs of Oct4 represented as PWMs (position weight matrices). POU binding sites are underlined. d Proportion of ChIP-seq peaks in each occupancy trajectory featuring ‘any’ (consensus motifs shown in c) or ‘none’ of these POU motifs. e Fraction of binding locations for each occupancy trajectory containing the indicated POU motifs. ‘All’ refers to peaks where motif scanning concurrently detected all the POU motifs listed in (c) and ‘none’ the absence of any of these motifs. f Genome browser track of Oct4 ChIP-seq peaks (shaded gray) for selected trajectories. Genomic coordinates for the summits are listed in Supplementary Table 4. g Genome browser tracks of constitutively bound Oct4 and Sox2 ChIP-seq peaks containing either SoxOct (near Sox21 gene) or MORE (near Spata13 gene) motifs. h Gene expression (mean tag counts as bar and individual technical replicate as dots) of Sox21 and Spata13 in the Oct4 condition. i EMSAs using Oct4-POU and Sox2-HMG protein constructs and DNA probes containing SoxOct elements (near the Sox21 gene) or MORE elements (near the Spata13 gene). EMSA probes are provided in Supplementary Table 5. j STARR reporter assay38 in ESCs with Oct4 bound regions from (g) near Sox21 or Spata13. The positive and negative control sequences are shown in Supplementary Table 8. Each data point (n = 4, biological replicates) is shown with mean as black bar; indicated p-values were calculated by Student’s t-test. Source data for i and j are provided as a Source Data file

