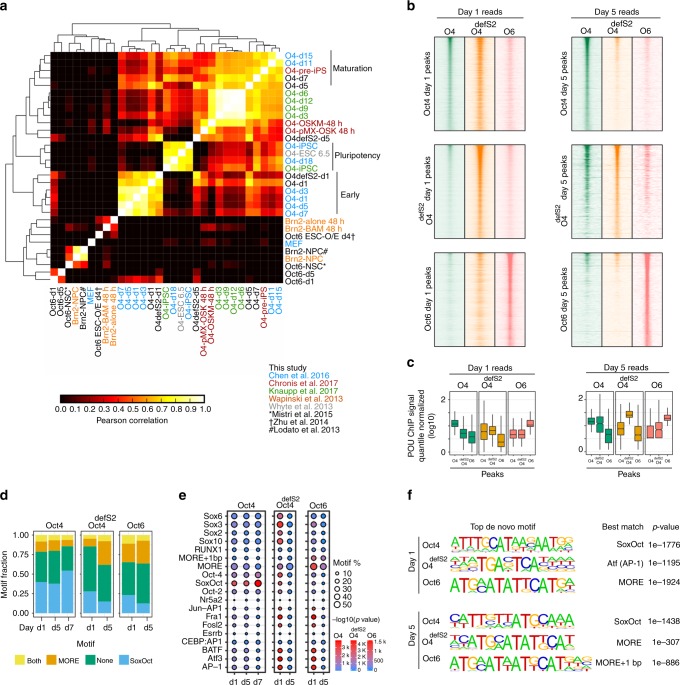
Fig. 3.
POU TFs exhibit distinctive binding profiles and motif preferences. a Hierarchical clustering of the pairwise correlation coefficients (R2) of ChIP-seq signals from Oct4, Oct4defSox2 and Oct6 ChIP-seq peaks with publically available ChIP-seq datasets for Oct4, Oct6 and Brn24–6,18,20,22,39,69. b ChIP-seq signal heatmaps for Oct4 (green), Oct4defSox2 (orange), and Oct6 (salmon) at days 1 (left panels) and 5 (right panels) centered on ChIP-seq peaks for Oct4 (top panels), Oct4defSox2 (middle panels) and Oct6 (bottom panels). c Boxplots of quantile normalized ChIP-seq signals at Oct4, Oct4defSox2 and Oct6 peaks at days 1 and 5 from heatmaps in (b). For the boxplots, the midline indicates the median, boxes indicate the upper and lower quartiles and the whiskers indicate 1.5 times interquartile range. d Fraction of binding locations containing MORE (including MORE variant with 1 bp spacer) or SoxOct elements at different reprogramming stages. ‘Both’ refers to peaks where motif scanning detected MORE and SoxOct motifs concurrently and ‘none’ the absence of either of the two motifs. e Enrichment of selected TF motifs in ChIP-seq peaks at days 1 and 5 for Oct4, Oct4defSox2, and Oct6. Size represents fractional occurrences and color gradient the p-value scores. f Top de novo motifs for Oct4, Oct4defSox2 and Oct6 at days 1 and 5. In the HOMER database the MORE motif is designated as Pit1 and MORE + 1 bp as Pit1 + 1bp70

