Fig. 6.
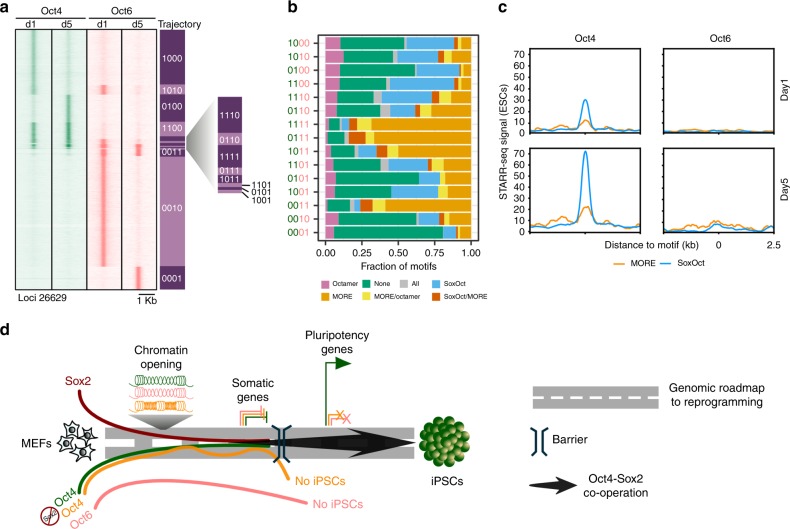
Oct6 binds to alternative targets and avoids pluripotency enhancers. a Comparison of Oct4 (green color) and Oct6 (salmon color) ChIP-seq signals at days 1 and 5 of reprogramming. Rows are 15 occupancy trajectories defined by the presence or absence of Oct4 or Oct6 peaks at day 1 or 5 (1 = binding, 0 = absence of binding). The summits were merged if they were within 100 bp. Genomic locations are provided in Supplementary Data 2. b Fraction of POU motifs mapping to binding sites in each of the occupancy trajectories. c Read pileup plots of STARR-seq signal (enhancer activity) in ESCs at Oct4 (left) and Oct6 (right) binding sites at days 1 (up) and 5 (bottom) of reprogramming containing either SoxOct or MORE motifs. d Model for unique and dispensable roles of Oct4 at different stages of somatic cell reprogramming

