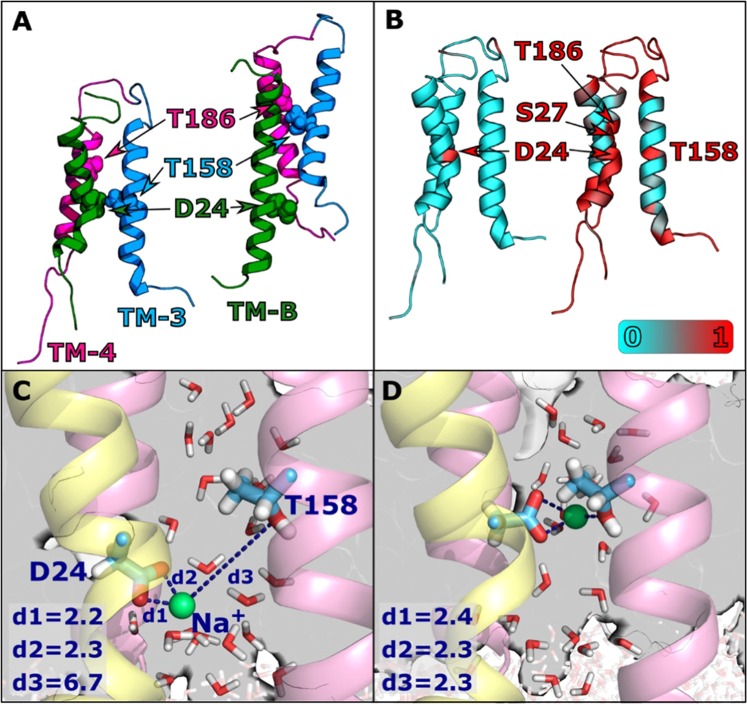
Figure 6.
MD simulation of the Na+ binding residues of the stator complex. (A) Channels 1 (left) and 2 (right) after 400 ns of the WT MD simulation. The three chains (TM-3, TM-4, and TM-B) are shown in blue, pink, and green, respectively. T158, T186, and D24 are represented as spheres. (B) Contact map for Na+ (left) and water (right). Channel residues (Cα) are colored according to the fraction of time during the simulation in which they form an interaction with a Na+ ion or a water oxygen atom. An interaction between a protein residue and an atom is defined as any (non-hydrogen) atom of the residue residing within 3.5 Å of the Na+ ion or water oxygen. Results were calculated using simulation frames saved every 1 ns from the last 375 ns of the 400 ns WT MD simulation. (C) and (D) Distances (d1, d2, d3, in Å) of Oδ1 -D24, Oδ2 -D24 (TM-B, rendered as sticks on yellow ribbon), and Oγ1 -T158 (rendered as sticks on pink ribbon) to the nearest Na+ ion (green sphere), after 105 ns (C), and after 106 ns (D) of the WT MD simulation. Water molecules in the vicinity of the above-mentioned residues are displayed as sticks.

