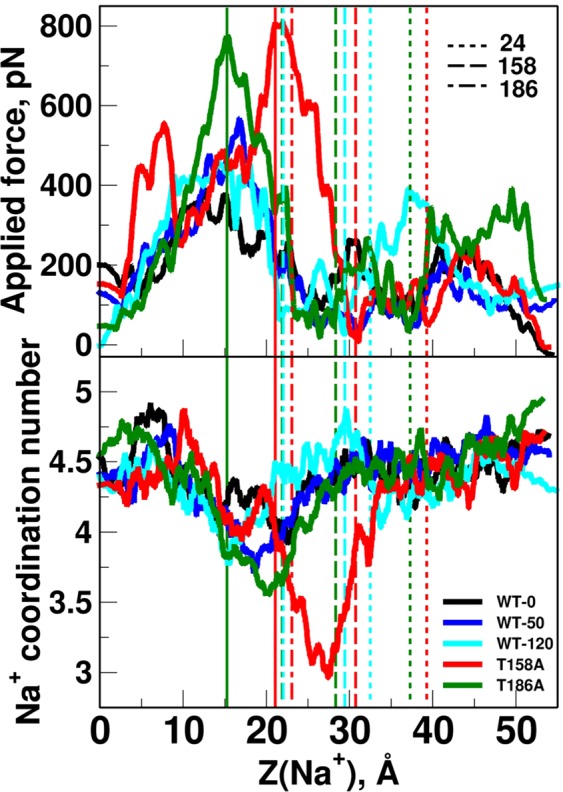
Figure 7.

SMD simulation of Na+ ion moving in the ion channel. Top: applied force during the SMD simulation vs. z coordinate of moving Na+ ion. Bottom: Coordination number of Na+ vs. its z coordinate. Coordination number is considered as the number of polar atoms (O, N, S of protein and water) within 2.5 Å of Na+. For both panels: Direction of movement is from left to right. Each line consists of data assembled from all 10 simulations of each set. Individual SMD profiles are presented in Fig. S5A. For clarity of vision, each data point is calculated as an average over its 500 (top) and 100 (bottom) surrounding data points. Data before averaging is presented in Fig. S5B. Data averaged with increasing number of SMD trials (1, 2, 3, 5, 8, and 10) is presented in Fig. S6. Average z coordinates of T/A158, T/A186, and D24 (Oγ1 for Thr, Cβ for Ala, and Oδ1 for Asp) during the simulations are marked as dashed vertical lines (for SMD-WT-120 and the mutants’ simulations). Numbers next to the dashed lines in the legends mark the residue numbers D24, T/A158, and T/A186. Lines for average z coordinate for T/A186 in WT-120 and T186A runs (3rd and 4th lines from the left) slightly overlap. Locations of the maximal force peak for T158A and T186A simulations are marked as solid vertical lines.
