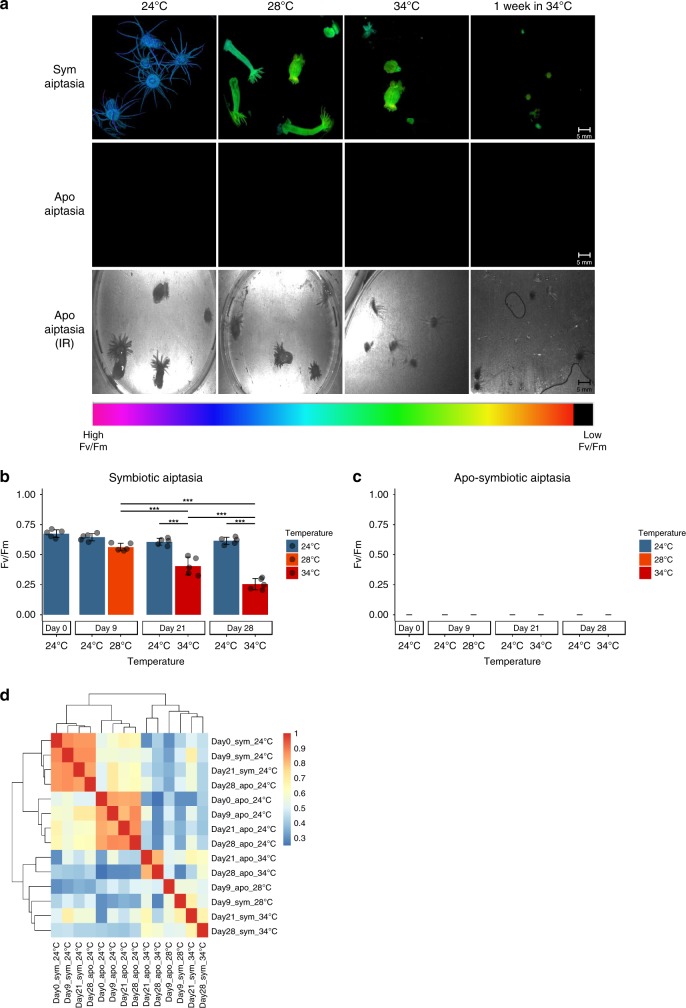
Fig. 1.
IPAM Fv/Fm measurements of symbiotic and apo-symbiotic Aiptasia prior to sampling for symbiosis state validation: a IPAM image as captured prior to sampling color scale indicates Fv/Fm value, and infra-red (IR) image indicates the apo-symbiotic Aiptasia position in the frame. b Quantitative results of Fv/Fm as measured with IPAM for symbiotic Aiptasia n = 5, One-way ANOVA: P-value < 0.001, Post-hoc Tukey-HSD: P-value < 0.001. c Quantitative results of Fv/Fm as measured with IPAM for apo-symbiotic Aiptasia n = 5. d ATAC-seq signal within consensus ATAC-seq peaks was compared between all samples using Spearman’s ρ to cluster samples

