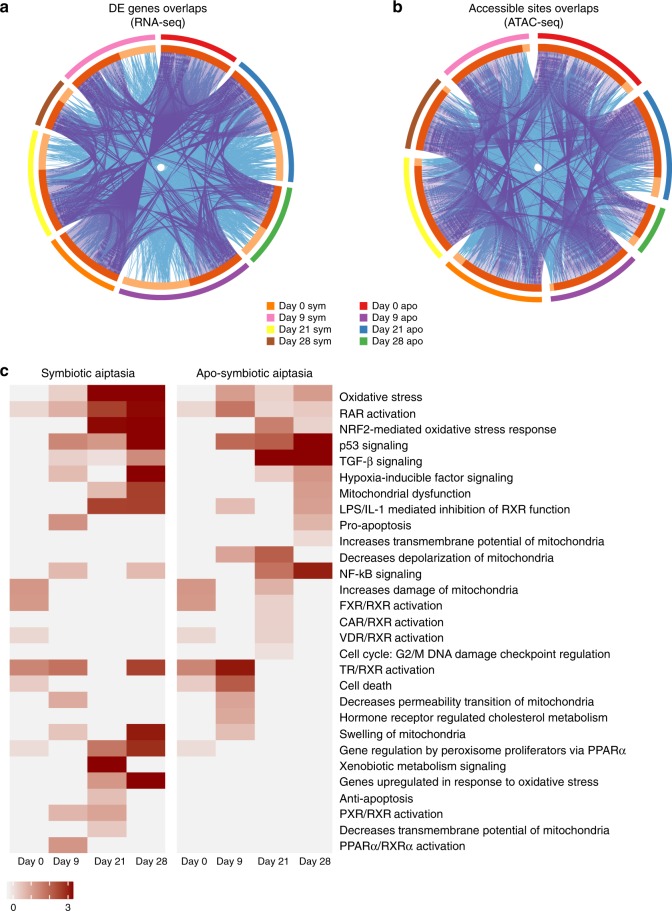
Fig. 6.
Canonical pathways enrichment analysis demonstrate different reactions to heat stress of morph. a, b Overlap among gene lists at the gene level, where purple curves link identical genes and blue curves link genes belong to the same enriched ontology term. The inner circle represents gene lists, where hits are arranged along the arc. Genes hit multiple lists are colored in dark orange, and genes unique to a list are shown in light orange. c Top canonical pathways found enriched within morphs were selected and compared to each other reviling different response to heat-stress

